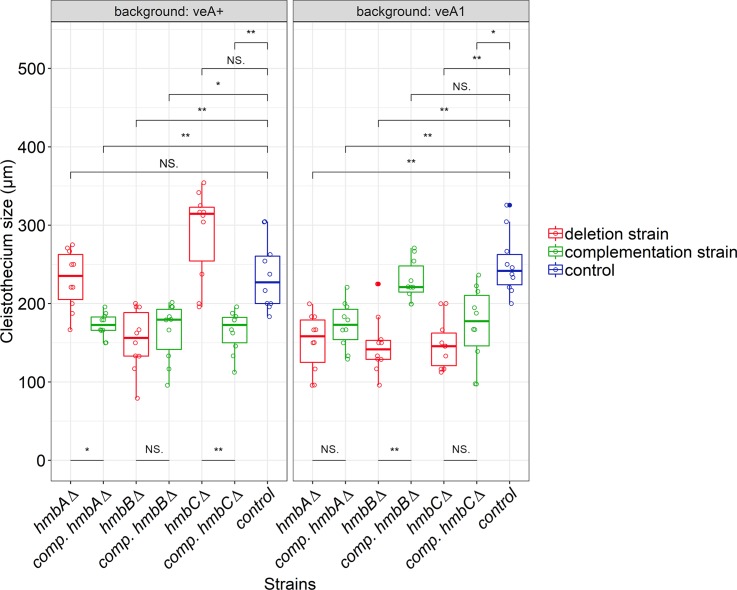
Fig 2. Size of cleistothecia in hmbAΔ, hmbBΔ and hmbCΔ mutants in veA+ and veA1 genetic backgrounds.
The boxplot shows the size of cleistothecia across the hmbA, hmbB and hmbC mutant and control strains in both the veA+ (left panel) and the veA1 (right panel) genetic backgrounds. The strains are color-coded as follows: blue denotes control; red denotes deletion, green denotes complementation (comp.) strains originating from the corresponding deletion strains. Centre lines indicate the median of 10 independent cleistothecia measurements per strain. Mann-Whitney U-test was used to assess size differences between the mutant and control strains in the corresponding genetic background. */** indicates p < 0.01/0.001, NS indicates p = not significant. Cleistothecia sizes were estimated by measuring the diameter of cleistothecia with a ruler (for further details see S4 Fig). The strains used in the experiment are as follows: veA+ control (HZS.450), veA1 control (HZS.145), hmbAΔ veA+ (HZS.521), hmbAΔ veA1 (HZS.239), hmbAΔ veA+ with hmbA complementation (HZS.678), hmbAΔ veA1 with hmbA complementation (HZS.621), hmbBΔ veA+ (HZS.495), hmbBΔ veA1 (HZS.280), hmbBΔ veA+ with hmbB complementation (HZS.680), hmbBΔ veA1 with hmbB complementation (HZS.677), hmbCΔ veA+ (HZS.531), hmbCΔ veA1 (HZS.338), hmbCΔ veA+ with hmbC complementation (HZS.679), hmbCΔ veA1 with hmbC complementation (HZS.676).

