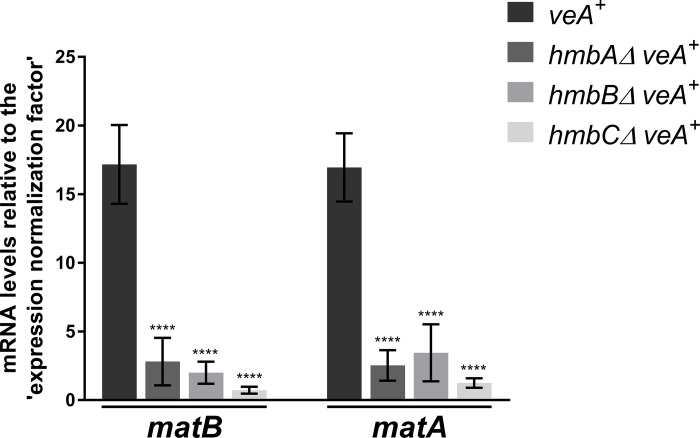
Fig 4. mRNA levels measured by qRT-PCR for MAT1-1 coding matB and MAT1-2 coding matA genes in veA+ control and veA+ hmbAΔ, hmbBΔ and hmbCΔ strains 96 h after the induction of sexual development.
Results, obtained by calculations according to the standard curve method [47], were normalized to an ‘expression normalization factor’ calculated from two selected reference genes (tubC and gpdA) (detailed in S1 Materials and methods). Standard deviations of three technical replicates of three biological samples are shown. The stars above the columns indicate the significance of the differences compared to the veA+ control. Significant differences between the mutants and the control were determined by using a two-way ANOVA test. **** indicates p < 0.0001. The following strains were used in the experiment: veA+ (HZS.450), hmbAΔ veA+ (HZS.521), hmbBΔ veA+ (HZS.495) and hmbCΔ veA+ (HZS.531). The cultivation settings were as follows: approximately 106 conidiospores per strain were inoculated into liquid MM, and were grown for 24 hours at 37°C with 180 rpm shaking. Then the vegetatively grown mycelia were transferred onto solid MM covered with cellophane, sealed carefully with scotch tape and incubated for 96 hours at 37°C in complete darkness. After the incubation period, total RNA was extracted and processed.

