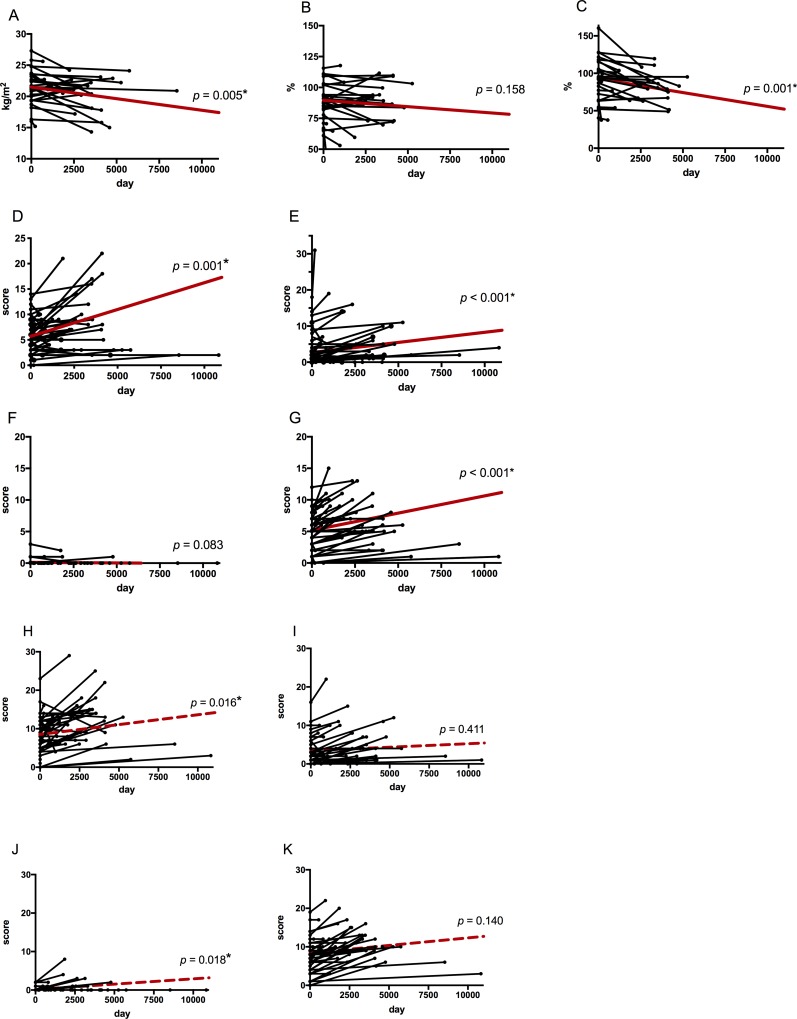
Fig 2. Longitudinal changes in clinical features of the untreated group.
The horizontal axis shows the observation period. The vertical axis shows clinical features or radiographic scores of chest X-ray (CXR) and chest computed-tomography (CT). Each bold red line represents the average profile of the group using the mixed effect model. A: Body mass index (BMI); B: %VC (vital capacity as percent of predicted); C: %FEV1 (Forced expiratory volume in 1 second as percent of forced vital capacity); and radiologic scores of D: nodule (CXR), E: infiltrate (CXR), F: cavity (CXR), G: ectasis (CXR), H: nodule (CT), I: infiltrate (CT), J: cavity (CT), and K: ectasis (CT). *: Asterisks denote significant changes in the entire group through the observation period. Radiological findings score on CXR are shown. n = 50, 50. Radiological findings score on CT are shown. n = 47, 45.

