Fig 6.
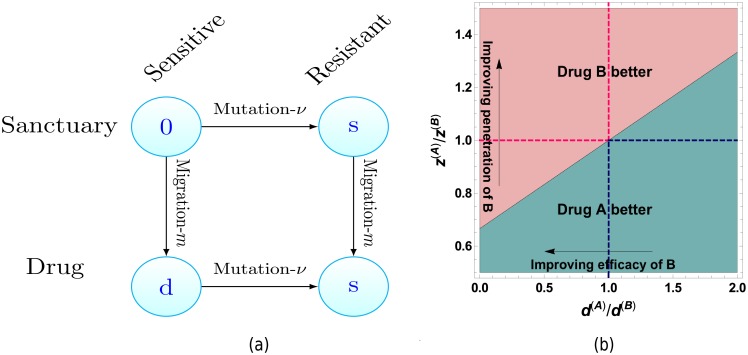
(a) In the case of monotherapy, there are two paths by which drug resistant cells can arise in the region containing the drug. Horizontal edges represent changes in genotype (gaining resistance) whereas vertical edges represent changes in spatial location. The labels of vertices are the fitness cost cells experience in that state and μ, m are the per cell mutation and migration rates. (b) Comparison of two drugs with differing efficacies and penetration profiles using (15). Arrows pertain to characteristics of drug B relative to drug A. Top left and bottom right quadrants illustrate region where drugs are trivially better, i.e. have superior penetration and efficacy. Parameters: d(A) = 10−2, s = 5 × 10⁻³.

