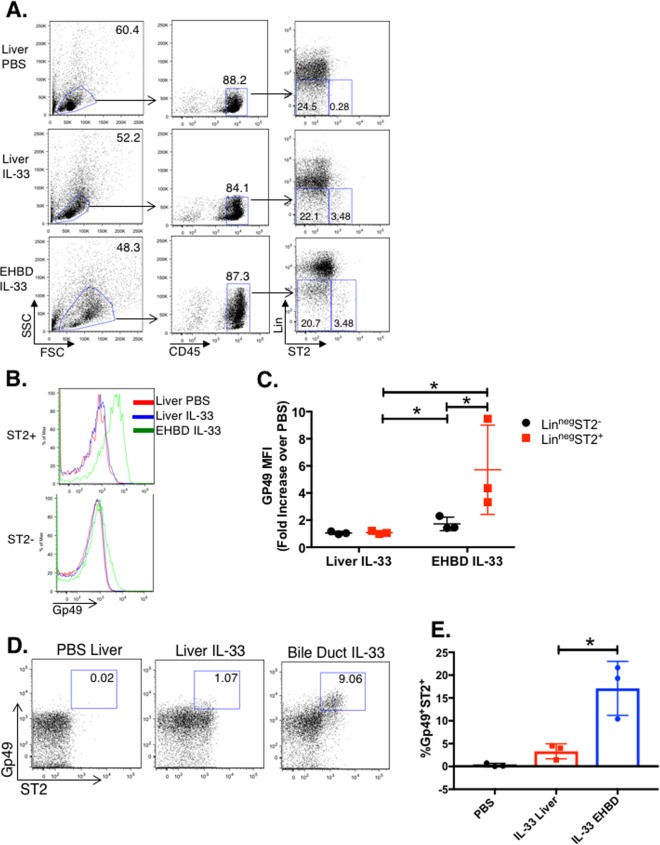
Fig 6. Validation of the BIM cell class by flow cytometry.
Mice were treated with either PBS or IL-33 for 4 days, after which mononuclear cells were isolated from liver and EHBD tissue as described in Methods, stained with florescent antibodies, and analyzed by flow cytometry. Gating strategy (A) to identify CD45+LinnegSt2+ vs. St2- mononuclear cells in liver and EHBD after PBS- or IL-33 treatment (representative of 3 independent experiments). (B) shows relative expression of BIM cell-class specific marker, Gp49, in ST2+ vs. ST2-CD45+Linneg mononuclear cells isolated from PBS-treated liver (red histogram) or IL-33-treated liver (blue histogram) or EHBD (green histogram); (representative of 3 independent experiments). (C) shows Gp49 MFI, expressed as fold-increase over PBS (combined from 3 independent experiments), * = p<0.05 by one-tailed Student’s t-test. Representative dots plots (D) and quantification from 3 independent experiments (E) of flow cytometric assays show that BIM are induced specifically in the extrahepatic bile duct but not in liver after IL-33 treatment. Mean ± s.d., 3 replicates, * = p<0.05 by 2-tailed Student’s t-test.

