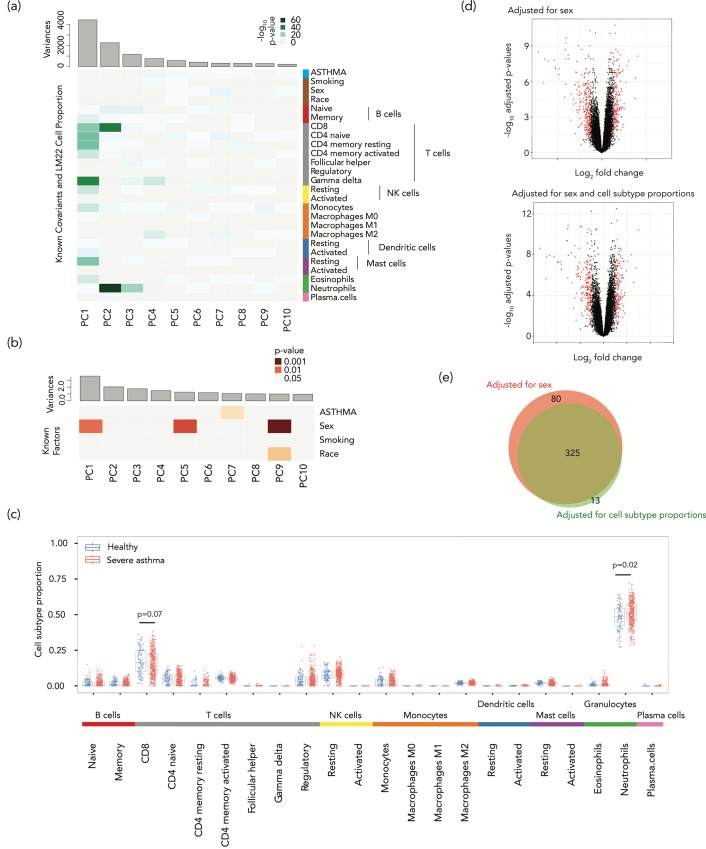
Fig 1. Deconvolution shows a strong effect of cell subtype proportions on gene expression variation in a study of blood leukocytes from asthmatics.
(a) Principal components for gene expression with significance of association of different factors shown as a heat map. The disease status of severe asthma (ASTHMA) was very weakly associated with the variability in gene expression, accounting for only 0.31% of the first PC (which accounts for 20.9% of the variance, p = 0.25) and 4.1% of the second PC (10.68% of the variance, p = 2.9×10⁻⁵) of expression variation. (b) The same kind of analysis was performed but this time testing the contributions to the cell subtype proportional variability, with small contributions to principal component 1 (accounting for 16.54% of variance) of disease status (0.023%, p = 0.75) and sex (1.56%, p = 0.01). (c) Looking into why the cell subtypes were so influential in altering gene expression, we find the proportions of two cell types to be significantly different in patients with severe asthma, an increased proportion of neutrophils (p = 0.021, Mann-Whitney test) and a decreased proportion of CD8+ T cells (p = 0.072, Mann-Whitney test). In (d) we show two volcano plots, the upper showing 405 differentially-expressed genes (DEGs, FDR-adjusted p value <0.05, >1.2 fold change in expression) in red, representing those identified without cell subtype proportion adjustment. The lower volcano plot shows the 166 DEGs following adjustment for cell subtype proportions using the PCs most strongly reflecting the cell subtype effects on expression variation. (e) The Venn diagram shows the overlap between the genes identified as differentially-expressed when adjusted for sex (red) and after additional adjustment for cell subtype proportional variation (green).

