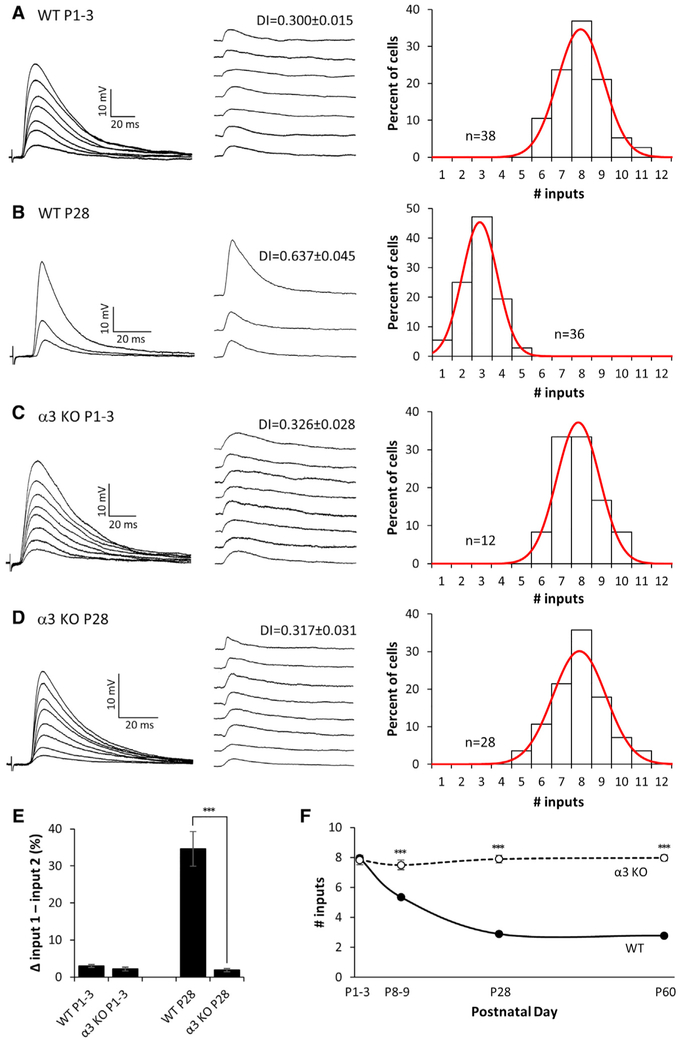
Figure 1. Preganglionic Axons Innervating Neurons in α3-KO SCG Do Not Refine.
(A–D) Left: representative compound EPSPs in an SCG neuron from (A) P1–P3 WT, (B) P28 WT, (C) P1–P3 α3-KO, and (D) P28 α3-KO mice evoked by increasing stimuli to the preganglionic nerve. Middle: the EPSPs evoked by individual preganglionic axons are shown. DI, disparity index. Right: distribution of SCG neurons innervated by the number of inputs; each distribution was fit with a Gaussian function. The distribution for P28 α3 KO is not significantly different from P1–P3 WT or α3 KO (p > 0.2), but it is significantly different from P28 WT (p < 0.001). Each distribution in (A)–(D) contains data from at least 4 mice. n, number of neurons.
(E) The average difference in strength between the strongest and second strongest inputs, expressed as a percentage of the maximum compound EPSP.
(F) The average number of axons innervating an SCG neuron in WT (solid line) and α3-KO (dotted line) mice at P1, P4, P28, and P60.
For (E) and (F), error bars represent ± SEM.
***p < 0.001.

