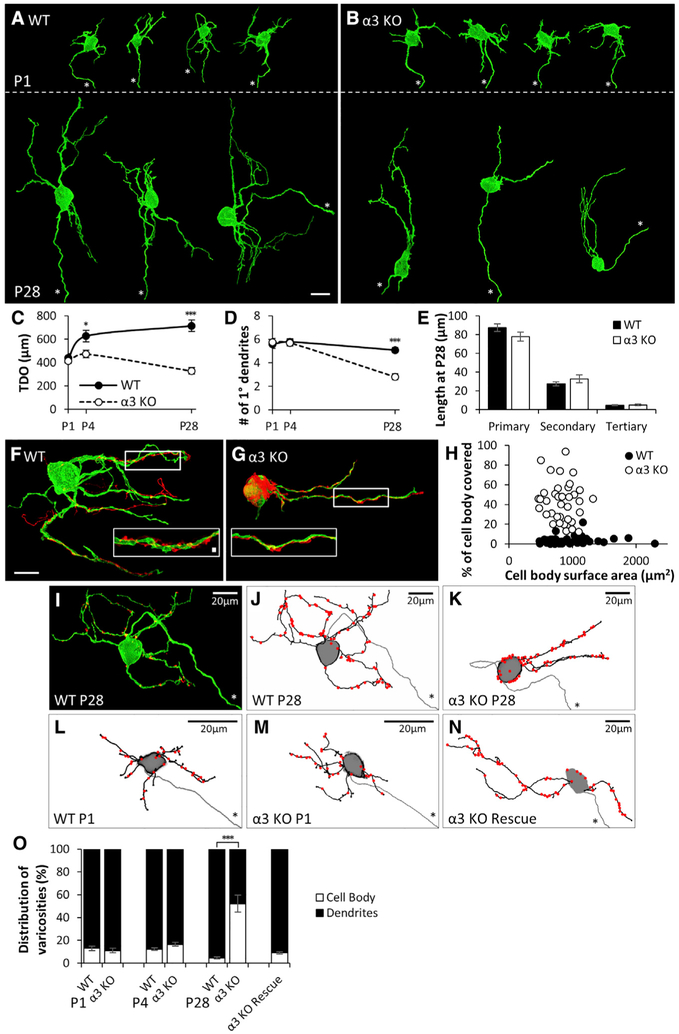
Figure 3. Primary Dendrites Are Not Maintained without Postsynaptic Activity, and Preganglionic Axons Target Silent Synapses to the Soma.
(A and B) Maximum-intensity projections of DiO-labeled SCG neurons from (A) WT and (B) α3-KO mice labeled at P1 (top) and at P28 (bottom). Axons are marked by an asterisk. Scale bar, 20 μm. In each panel, neurons are from different ganglia and have been tiled for comparison.
(C) Average total dendritic outgrowth (TDO) per neuron at P1, P4, and P28; filled circles represent WT and open circles represent α3 KO in this panel and (D).
(D) Average number of primary dendrites per neuron at P1, P4, and P28.
(E) Average length of primary dendrites, secondary branches, and tertiary branches at P28; filled columns represent WT and open columns represent α3 KO.
For (C)–(E), error bars represent ± SEM. *p < 0.05 and ***p < 0.001. WT: for P1, n = 23 neurons (10 mice); for P4, n = 28 neurons (10 mice); and for P28, n = 34 neurons (12 mice). α3 KO: for P1, n = 20 neurons (10 mice); for P4, n = 24 neurons (10 mice); and for P28, n = 36 neurons (14 mice).
(F and G) Maximum-intensity projections of DiO-labeled P28 SCG neurons (green) innervated by Dil-labeled preganglionic axons (red) in (F) WT and (G) α3-KO SCG. Scale bar, 20 μm. Inset: the boxed region at higher magnification shows preganglionic axons (red) with varicosities along a segment of dendrite (green). Scale bar, 2 μm.
(H) Percentage of neuronal cell body covered by preganglionic axons for P28 SCG neurons of different sizes. (WT, filled circles, n = 50 neurons (16 mice), α3 KO, open circles, n = 38 neurons (13 mice)).
(I) DiO-labeled neuron (green) from a P28 WT SCG immunostained for VAChT (red). Axon is marked by an asterisk. VAChT puncta not touching the neurons were removed for clarity.
(J–N) Skeletonized reconstructions showing dendritic arbors (black), axon (gray, marked by an asterisk), and preganglionic axon varicosities (red), determined by VAChT staining, as in (A). (J) WT neuron from (I), (K) α3-KO neuron at P28, (L) WT neuron at P1, (M) α3-KO neuron at P1, and (N) α3-KO SCG neuron 1 month after rescue with Ad-α3 are shown. Neurons in (I)–(K) and (N) are shown at the same scale, and neurons in (L) and (M) are magnified for clarity.
(O) Average distribution of varicosities on the cell body (open) and dendrites (filled) in WT and α3-KO SCG at P1, P4, and P28 and on α3-KO neurons 1 month after rescue with Ad-α3. Error bars represent ± SEM. ***p < 0.001. WT: for P1, n = 6 neurons (3 mice); for P4, n = 9 neurons (5 mice); and for P28, n = 10 neurons (4 mice). α3 KO: for P1, n = 6 neurons (5 mice); for P4, n = 10 neurons (4 mice); and for P28, n = 11 neurons (4 mice). For α3-KO rescue, n = 12 neurons (8 mice).

