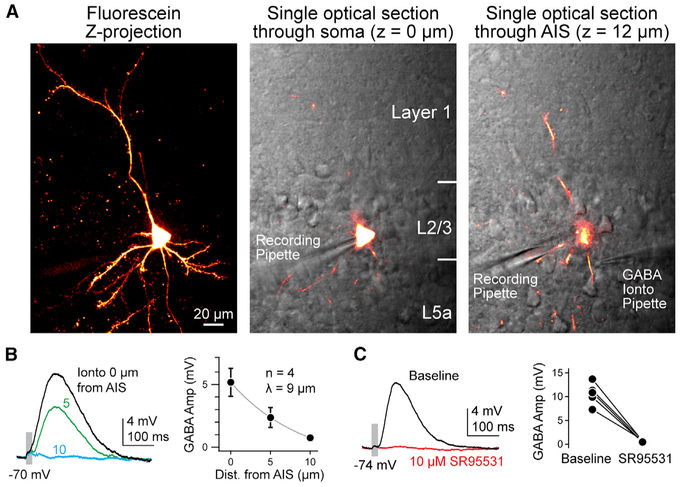
Figure 1. Methods for Assessing ECl in Specific Neuronal Compartments.
(A) Left: maximum intensity z series projection of fluorescein-filled layer 2/3 pyramidal cell in medial PFC. Middle: single optical in plane with the somata detailing fluorescein in cell. Simultaneous scanning differential contrast image is overlaid in grayscale, detailing cell location within PFC and recording pipette. Right: single optical at the AIS (12 μm above soma), highlighting GABA iontophoretic (Ionto) pipette apposed to AIS. Segments of dendrites are also observed.
(B) Left: example of response from iontophoretic delivery at varying distances from the AIS. Pipette was withdrawn perpendicular to the main axis of the axon. Right: average amplitude (Amp) ± SEM of IPSP versus pipette distance (Dist.) from neurite. Gray line indicates exponential fit.
(C) Left: example of response before and after application of SR95531. Right: peak amplitude of IPSPs before and after SR95531. Circles indicate individual cells; bars connect within-cell measurements.

