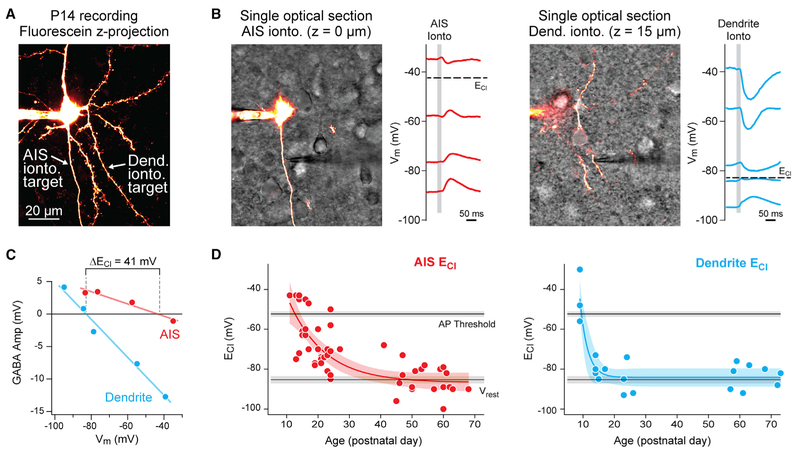
Figure 2. Development of ECl in the Dendrites and AIS.
(A) Maximum intensity z series projection of fluorescein-filled layer 2/3 pyramidal cell in medial PFC. Arrows indicate position of iontophoretic (ionto.) pipettes on the AIS and dendrite (Dend.) at different focal points. Dendrites are distinguished from the axon by the presence of spines.
(B) Left: same neuron as in (A). Slice is visualized using scanning Dodt contrast image (grayscale). Note the focus of the iontophoresis pipette near the AIS. Neuron was held with constant current at multiple membrane potentials to determine ECl at AIS. Gray bar denotes iontophoresis epoch. Note the predominantly depolarizing PSPs. Right: same neuron with iontophoretic pipette relocated to basal dendrite. Note the predominantly hyperpolarizing PSPs that lead to differences in ECl across compartments.
(C) Linear fits to peak of GABA currents versus holding Vm was used to determine local ECl. Data are from the cell in (A). Amp, amplitude.
(D) Summary of AIS (red) and dendritic (blue) ECl values across development. Circles indicate single data points, and curves indicate an exponential fit ± 95% confidence interval. Black lines and gray bars indicate average mean ± 95% confidence interval for spike threshold and Vrest across all recordings.

