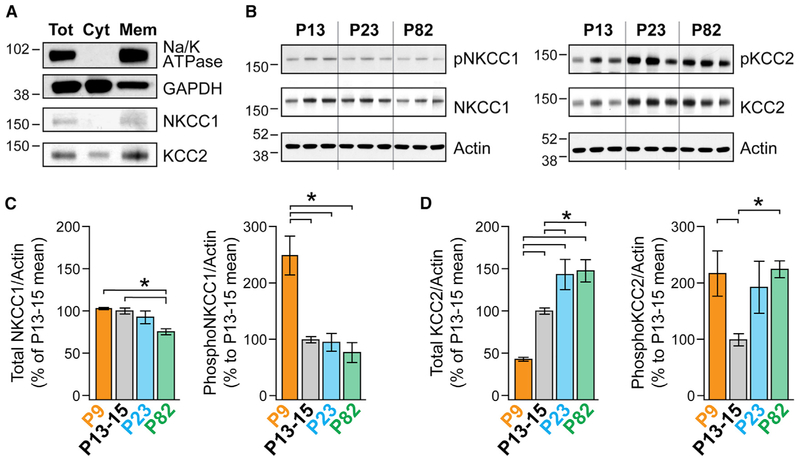
Figure 3. Age-Dependent Differences in Membrane NKCC1 and KCC2 Protein Level and Phosphorylation.
(A) Western blot analysis depicts the membrane enrichment of NKCC1 and KCC2 at p82. Anti-Na/K ATPase antibodies and anti-GAPDH antibodies were used as membrane (Mem) and cytosolic (Cyt) markers, respectively. Tot, total.
(B) The total protein and phosphorylation levels of NKCC1 and KCC2 were determined by western blot analysis. Actin was used as a loading control. Membranes were first probed with anti-phospho-NKCC1 antibodies (left) and anti-phospho-KCC2 antibodies (right), as well as anti-actin antibodies. Membranes were then stripped and re-probed with anti-NKCC1 antibodies (left) and anti-KCC2 antibodies (right). P9 samples (data not shown) were run in a separate gel including additional P13–P15 samples.
(C) ImageJ was used for optical density quantification. Data are presented as the average ratio of NKCC1/actin or phospho-NKCC1/actin. All data are normalized to their respective immunoreactivity at P13–P15. Error bars indicate mean ± SEM. ns = 6, 13, 7, and 7 animals for P9, P13–P15, P23, and P82, respectively. Significance was determined using an ANOVA with a Bonferroni post hoc test corrected for multiple comparisons (*p < 0.0083).
(D) Same as for (C), but for KCC2 and pKCC2.

