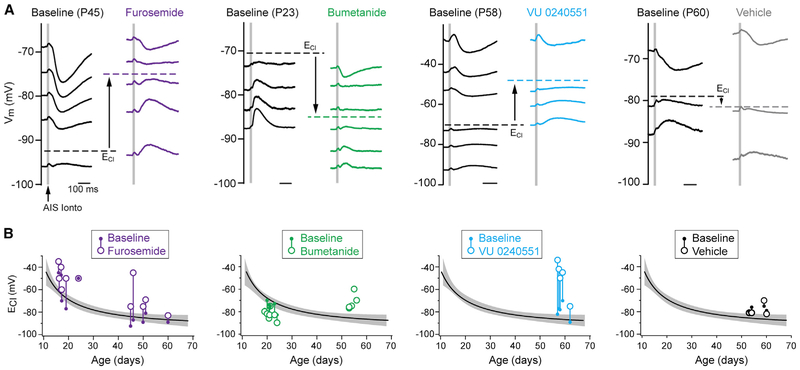
Figure 4. NKCC1 and KCC2 Differentially Regulate Pre- and Post-adolescent AIS ECl.
(A) Example traces of IPSPs from AIS iontophoresis at different ages depict shift of ECl from baseline to post-drug. Furosemide: broad-spectrum NKCC1/KCC2 inhibitor. Bumetanide: NKCC1 inhibitor. VY 0240551: KCC2 inhibitor. Scale bar, 100 ms in all traces. Note the direction of shift for each transporter inhibitor. Vehicle controls (far right) were performed over similar timescales as inhibitor application.
(B) Summary of NKCC1 and/or KCC2 block effect on ECl across development. Values of ECl for each recorded cell were obtained as depicted in (A) and plotted relative to the average AIS ECl developmental profile (Figure 2D). Baseline ECl: small filled circle; post-drug ECl: larger open circle; each pre-post pair is connected with a vertical line. Individual data points from bumetanide preincubation are shown as large, open circles only.

