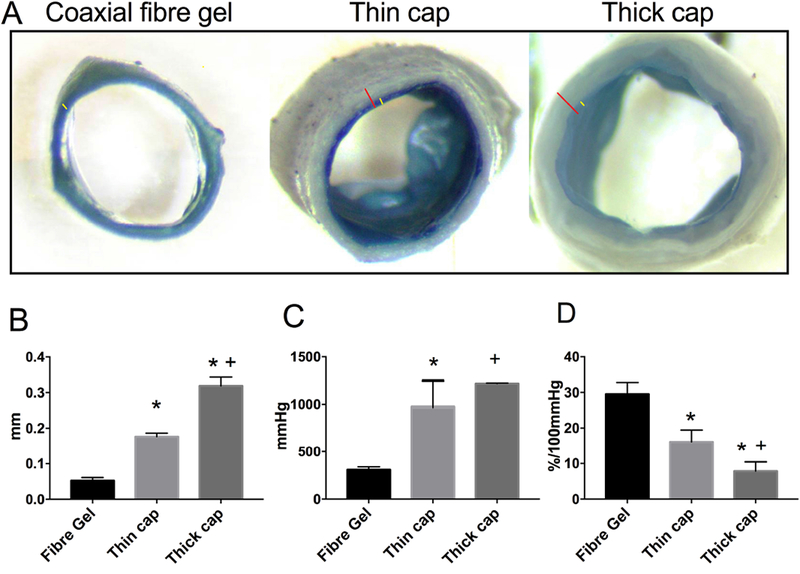
Fig. 2.

Structure and mechanical behaviors of tubular grafts with varied designs. (A) Representative images of tubular grafts showing varied graft wall structures. The layer of coaxial PCL/gelatin fibres is identified with yellow line while the overall wall thickness shown with red. The images were taken with the same magnification. (B) Average graft wall thickness. (C) Burst strength of grafts. (D) Graft compliance. Data represent mean ± SEM. n = 4; * p < 0.05, vs PCL:Gel (1:5). + p < 0.05, vs PCL:Gel (2.5:5). (For interpretation of the references to color in this figure legend, the reader is referred to the web version of this article.)
