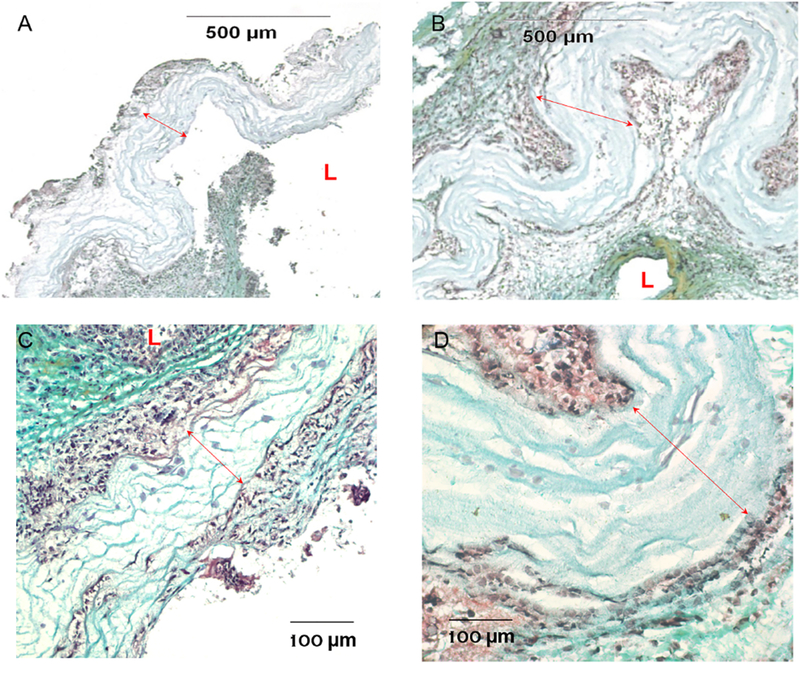
Fig. 7.

Histological analysis of grafts with pentachrome stain. (A–B) Representative images of thin-cap implant (A) versus thick-cap implant (B) with a 10× objective. The luminal area was significantly reduced in those with thick cap, which was accompanied by more significant wall remodeling in both luminal and abluminal areas. (C–D) Representaive images of thin-cap implant (C) versus thick-cap (D) with a higher magnification (40×), showing cell infiltration in the graft wall. “L” shows the luminen, and the red lines show the PCL material region. (For interpretation of the references to color in this figure legend, the reader is referred to the web version of this article.)
