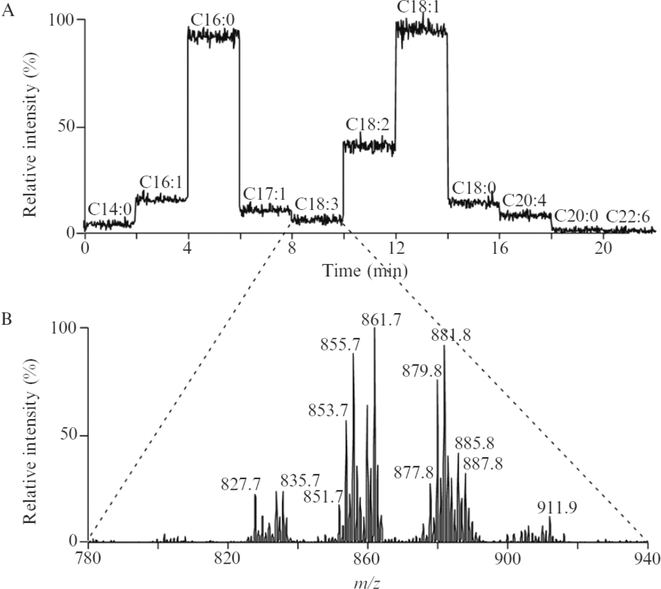
Figure 3:
(A) Total ion current chromatogram of stepwise neutral loss scanning (NL) of fatty acids (RCOOH and RCOOLi) during the infusion of TG molecular species as the lithium adduct [M+Li]+ from a human plasma lipid extract using the shotgun approach. Each segment of individual NL scanning was taken for 2 min. (B) An example of an averaged mass NL mass spectrum corresponding to loss of 284 u (i.e., RCOOLi=18:3 or RCOOH=18:0). This reveals which TG molecular species in this extract contained the fatty acyl groups-18:3/18:0. With permission from Elsevier, RW Gross and X Han, 2007(15).

