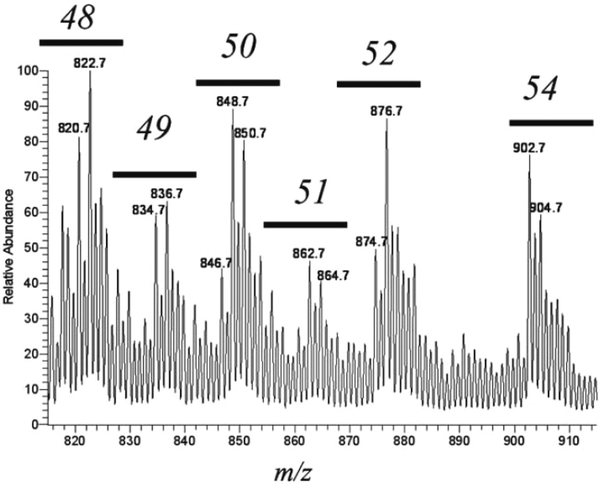
Figure 5:
ESI mass spectra of the neutral lipid fraction from RAW 264.7 cells obtained on a linear ion trap mass spectrometer showing the TG region of the mass spectrum, m/z 810 to 920 corresponding to TGs [M+ NH4]+ containing a total of 48 to 54 fatty acyl carbon atoms. With permission of the American Society for Mass Spectrometry, A McAnoy et al., 2005 (6).

