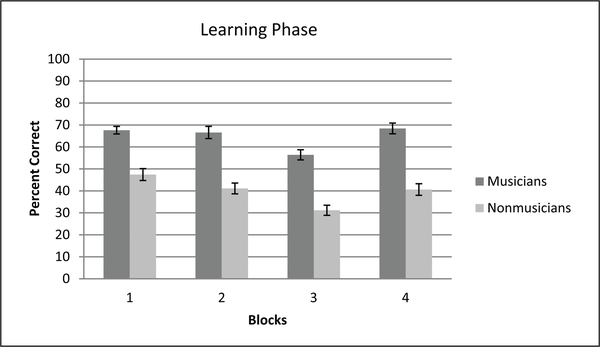
Figure 3.
Group differences in visual-spatial sequence learning across blocks in the learning phase. Percentage of correctly reproduced visual sequences is shown on the y axis. Blocks are shown on the x axis. Musicians are indicated in dark gray and nonmusicians are shown in light gray (standard error bars are included).

