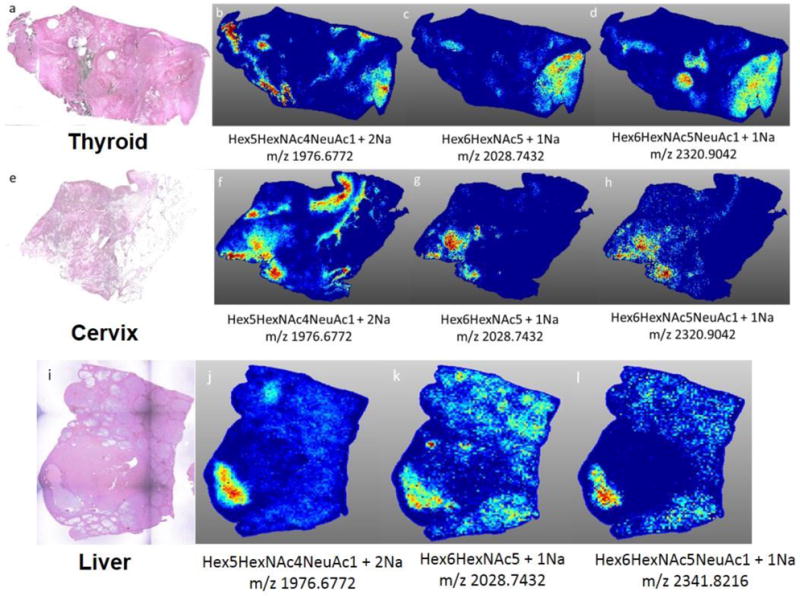
Figure 7. N-glycan necrosis profiles in other cancer tissues types.

Three representative necrosis glycans (Hex5HexNAc4NeuAc1, Hex6HexNAc5, Hex6HexNAc5NeuAc1) are shown for each cancer type. a) H&E of thyroid cancer tissue (anaplastic, grade IV). b–d) spatial localization of necrotic region specific glycans. e) H&E of cervical cancer tissue (well differentiated, invasive squamous cell carcinoma) f–h) spatial localization of necrotic region specific glycans. i) H&E of liver cancer tissue (well differentiated, grade IV, HCV+);(j–l) spatial localization of necrotic region specific glycans. MS images are from data analysis in SCiLS 2016b software.
