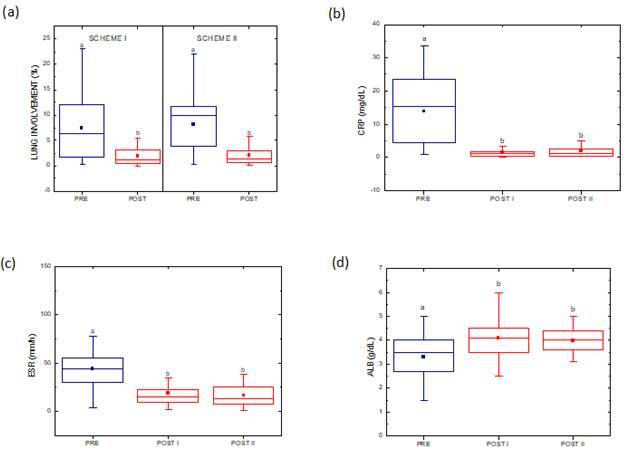
Figure 2. (a) Analysis of lung involvement between Scheme I and Scheme II (pretreatment median = 6% for Scheme I; pretreatment median = 10% for Scheme II; posttreatment median = 1% for both Schemes I and II). (b) Box-plot of CRP pre- and posttreatment in patients who were treated with Scheme I or Scheme II (POST I and POST II, respectively). Schemes I and II: pretreatment median = 15 mg/dl, posttreatment median = 1 mg/dl. (c) Box-plot of ESR pre- and posttreatment in patients who were treated with Scheme I or Scheme II (POST I and POST II, respectively). Scheme I and II: pretreatment median = 44 mm/h. Scheme I: posttreatment median = 15 mm/h. Scheme II: posttreatment median = 13 mm/h. (d) Albumin levels increased posttreatment compared with pretreatment in patients who were treated with Schemes I and II. The lower and upper boundaries of the boxes indicate the 25th and 75th percentiles, respectively. The solid horizontal lines in the boxes indicate the median. The squares represent the mean. The whiskers above and below the boxes represent the maximum and minimum values, respectively. a, b, significant difference (statistical analysis by Mood median test with p < 0.003 between pre- and posttreatment; and statistical analysis by Mann Whitney with p > 0.05 between Schemes I and II).

