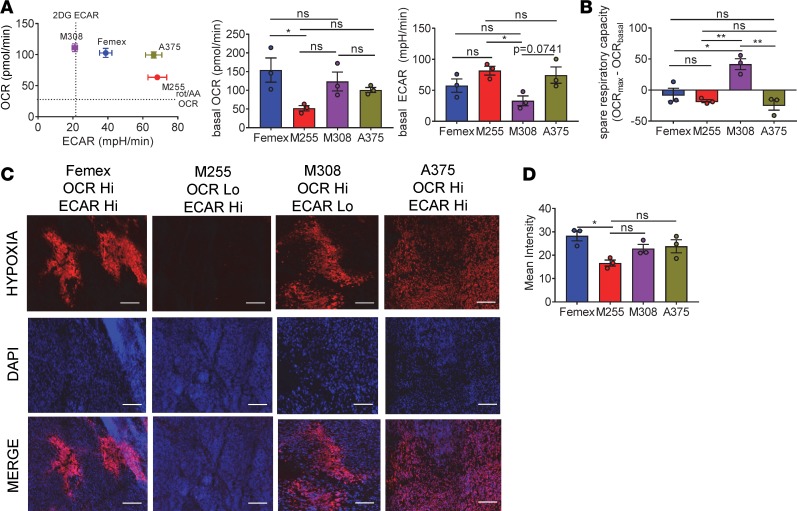
Figure 1. Melanoma cell lines are metabolically heterogeneous and produce various degrees of hypoxia in vivo.
(A) Representative OCR versus ECAR of human melanoma cell lines (left) and tabulated baseline OCR and ECAR (right) from multiple experiments. (B) Tabulated respiratory capacity (maximal, uncoupled respiration by FCCP stimulation) from cells as in A. (C) Pimonidazole staining of full tumor sections from NSG mice bearing human melanoma cell line tumors measuring 5 mm across. Scale bars: 100 μm. (D) Tabulated results of the internal hypoxyprobe intensity from set brightness normalized for each day of imaging. Data represent 3 independent experiments. *P < 0.05, **P < 0.01 by 1-way ANOVA. ns, not significant. Error bars indicate SEM.

