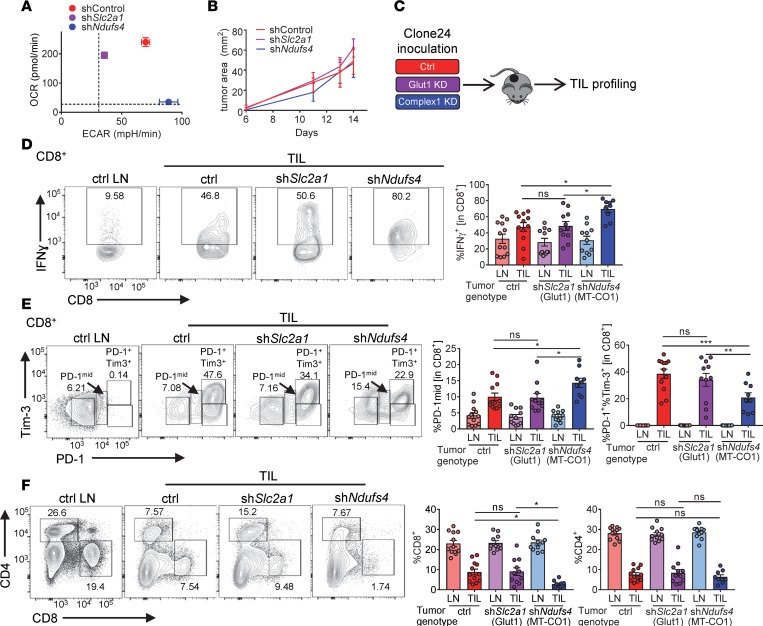
Figure 2. Oxidative metabolism in tumor cells promotes increased T cell dysfunction.
(A) Representative OCR versus ECAR of clone 24 melanoma cells transfected with scrambled control, Slc2a1 (Glut1), or Ndufs4 (complex I) shRNA. (B) Tumor growth curves of C57BL/6J inoculated with 250,000 of clone 24 melanoma cells as in A intradermally. (C) Schematic of TIL profiling from mice bearing clone 24 tumors. (D) Representative flow cytogram (left) and tabulated data from multiple experiments (right) of PMA- and ionomycin-induced IFN-γ from CD8+ T cells from clone 24–bearing mice. LN, lymph node; TIL, tumor-infiltrating lymphocyte (n = 12 per group). (E) Representative flow cytogram (left) and tabulated data from multiple experiments (right) of PD-1 and Tim-3 expression as in D. (F) Representative flow cytogram (left) and tabulated data from multiple experiments (right) of CD4+ and CD8+ T cells as in D. Data represent 5 independent experiments. *P < 0.05, **P < 0.01, ***P < 0.001 by 2-way ANOVA (A) or 1-way ANOVA (C–E). ns, not significant. Error bars indicate SEM.

