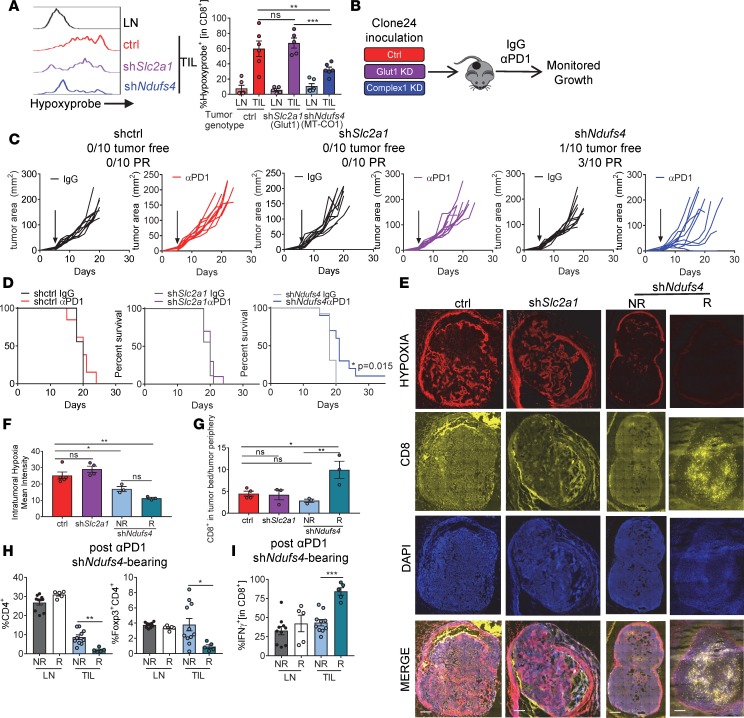
Figure 3. Inhibiting oxidative metabolism in tumor cells reduces intratumoral hypoxia and increases sensitivity to PD-1 blockade therapy.
(A) Representative pimonidazole staining and tabulated data from multiple experiments of CD8+ T cells isolated from clone 24 knockdown tumors (n = 6 per group). (B) Schematic of C57BL/6J mouse inoculated with 250,000 of clone 24 knockdown cells intradermally, and then treated with 200 μg anti–PD-1 or isotype controls thrice weekly when tumors reached 1–3 mm. (C) Tumor growth from mice treated as in B. Tumor-free indicates a complete regression. PR indicates mice that showed tumor regression for at least 2 measurements. Each line represents 1 animal. (D) Survival curve of mice treated as in B. (E) Pimonidazole, CD8, and DAPI staining of full tumor sections from mice bearing clone 24 knockdown tumors (left). Scale bars: 500 μm. (F) Tabulated results of the internal hypoxyprobe intensity from a set brightness normalized for each day of imaging (n = 4 per group). (G) Ratio of T cell counts in tumor bed versus periphery of tumor (n = 4 per group). (H) Tabulated flow cytometry data from multiple experiments of CD4+ and CD4+Foxp3+ T cells from clone 24 Ndufs4–knockdown mice treated with 200 μg anti–PD-1 (n = 5–10 per group). (I) Tabulated flow cytometry data from multiple experiments of IFN-γ in CD8+ T cells from mice as in H. Data represent 3 independent experiments. *P < 0.05, **P < 0.01, ***P < 0.001 by 1-way ANOVA (A–C and F–I) or log-rank test (D). ns, not significant. Error bars indicate SEM.

