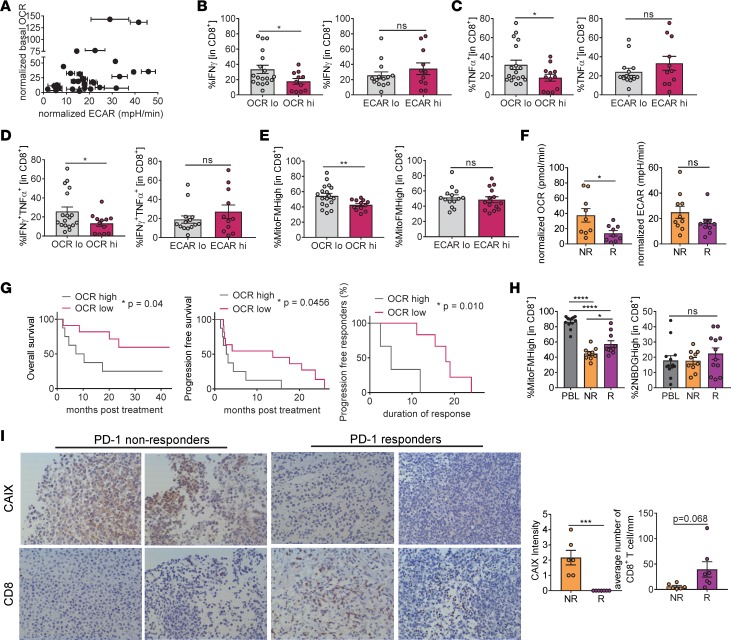
Figure 4. Oxidative metabolism of tumor cells and hypoxia are associated with decreased antitumor immunity and poor clinical response to PD-1 blockade therapy in patients.
(A) Normalized OCR versus normalized ECAR of isolated tumor cells from melanoma patient biopsies. Values normalized based on rotenone/antimycin A for OCR and 2DG for ECAR (n = 30). (B) Tabulated flow cytometry data of IFN-γ production from CD8+ T cells isolated as in A as a function of high OCR or ECAR. (C) Tabulated flow cytometry data of TNF-α from CD8+ T cells as in B. (D) Tabulated flow cytometry data of IFN-γ and TNF-α from CD8+ T cells as in B. (E) Tabulated flow cytometry data of MitoTracker FM from CD8+ T cells as in B. (F) Tabulated normalized OCR and tabulated normalized ECAR of isolated tumor cells from melanoma patients that progressed on (NR, nonresponder) or responded to (R, responder defined as stable disease, partial or complete response) (n = 19). (G) Overall survival, progression-free survival, and duration of response of patients treated with either pembrolizumab or nivolumab monotherapy based on tumor cell oxidative metabolism. (H) Representative flow cytogram (left) and tabulated data from multiple experiments (right) of MitoTracker FM and 2NBDG of CD8+ T cells from patients as in F. (I) Representative immunohistochemistry at ×20 magnification (left) and tabulated CAIX scoring and CD8+ T cell numbers of FFPE sections from patients as in F. *P < 0.05, **P < 0.01, ***P < 0.001, ****P < 0.001 by unpaired t test (B–F, H, and I) or Wilcoxon’s test (G). ns, not significant. Error bars indicate SEM.

