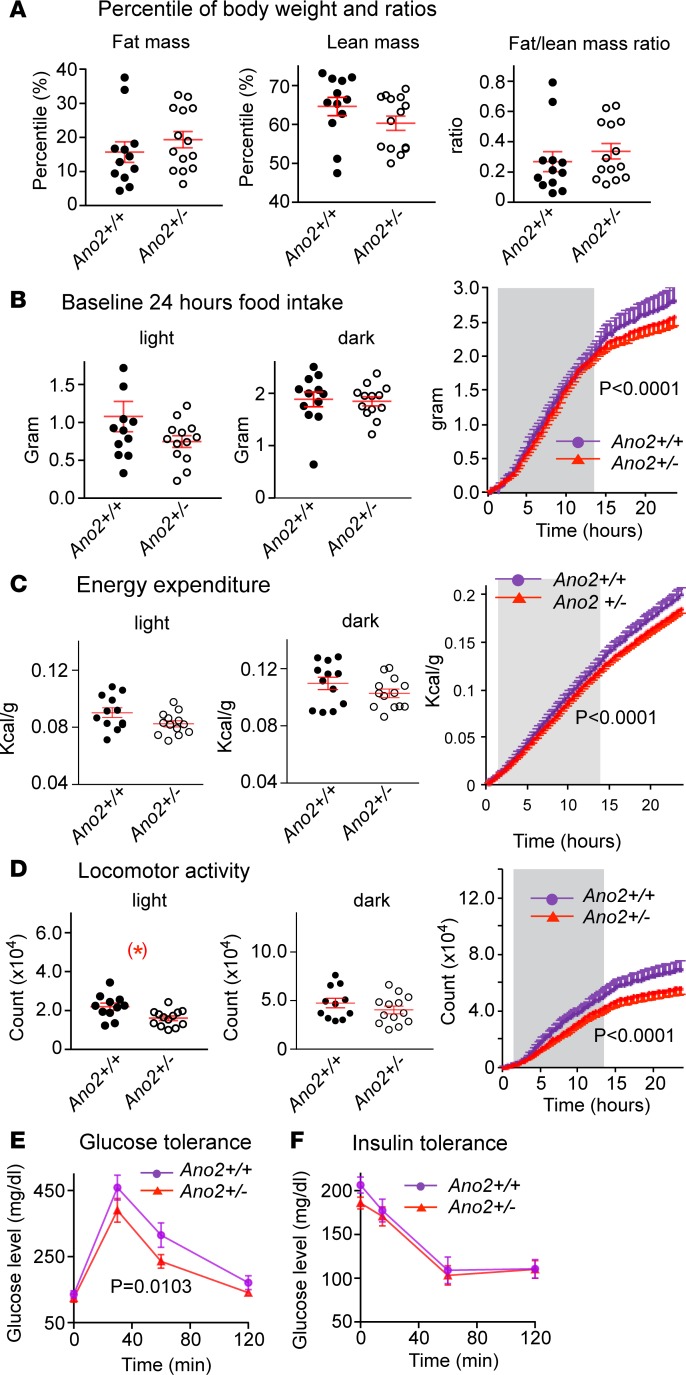
Figure 5. Metabolic changes in Nav1.8 Cre;Ano2fl/WT (Ano2+/–) mice.
(A) The percent body weight in Ano2+/+ vs. Ano2+/– mice is 15.6% ± 3.3% vs.18.4% ± 2.4% for fat mass, 65.0% ± 2.6% vs.61.1% ± 1.8% for lean mass and 0.267 ± 0.072 vs. 0.314 ± 0.048 for fat/lean mass ratio, respectively (Student’s t test, P > 0.05 for all). By excluding the 2 outliers of the 12 Ano2+/+ mice that had a percent fat mass that exceeded the mean by 3 SD, the calculated fat/lean mass ratio in this control (Ano2+/+) group decreased to 0.165 ± 0.026, making the increase in fat/lean mass ratio in Ano2+/– mice significantly greater statistically (Student’s t test, P < 0.05). (B) Food intake in control vs. Ano2+/– mice is 1.08 ± 0.20 vs.0.75 ± 0.08 g (P > 0.05) in light phase and 1.88 ± 0.14 g vs.1.84 ± 0.09 g (P > 0.05) in dark phase. The 24-hour cumulative food intake shows a significant decrease (right panel, P < 0.0001, 2-way ANOVA) mostly during the light phase and is associated with a decrease in locomotor activity. The dark phase (shaded) was between hours 6 p.m. and 6 a.m. (C) The energy expenditure of Ano2+/– mice is reduced in light and dark phases. The cumulative energy expenditure in Ano2+/– mice is significantly lower as shown during the light phase (unshaded; P < 0.0001, 2-way ANOVA). (D) The locomotor activity of Ano2+/– mice is reduced in light and dark phases. The cumulative locomotor activity is decreased in Ano2+/– mice through the 24-hour period (P < 0.0001, 2-way ANOVA). (E) The glucose tolerance test shows significantly lower glucose levels in the Ano2+/– mice at 30, 60, and 120 minutes after glucose injection (n = 12 mice in each group, P = 0.0103, 2-wayANOVA). (F) The insulin tolerance test shows no difference in glucose levels between control and Ano2+/– mice at 15, 60, and 120 minutes after insulin injection (n = 12 for Ano2+/+ and 13 for Ano2+/– mice, P > 0.05, 2-way ANOVA). Data are means ± SEM. Each dot or circle represents 1 mouse. Student’s t tests are applied in A and in the left and middle panels of B, C, and D; 2-way ANOVA are applied to right panels of B, C, and D. More values for locomotor activity, energy expenditure, and glucose and insulin tolerance are presented in Supplemental Table 1.

