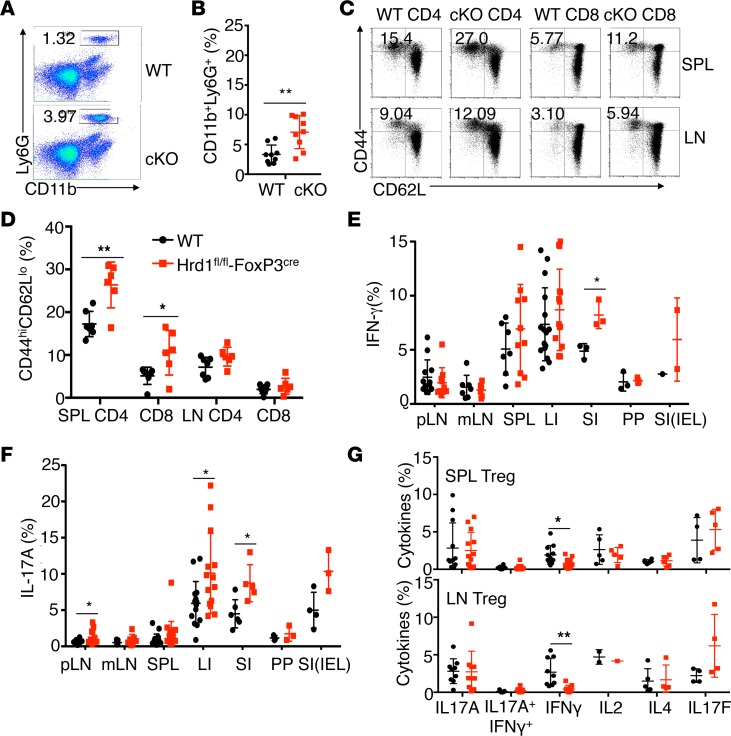
Figure 4. Increased T cell activation and altered immune homeostasis in Hrd1fl/fl-FoxP3cre mice.
(A and B) Representative images (A) and quantification (B) of neutrophils in the SPL in WT and Hrd1fl/fl-FoxP3cre mice (n = 8–9 per group). (C and D) Representative images (C) and quantification (D) of the expression of CD62L and CD44 on WT and Hrd1fl/fl-FoxP3cre splenic and LN CD4+ and CD8+ T cells (n = 6 per group). (E and F) Expression of IFN-γ+(E) and IL-17A+ (F) in CD4+ T cells from WT and Hrd1fl/fl-FoxP3cre mice (n = 3–16 per group). (G) Expression of Th subset cytokines in the SPL and LN Tregs from WT and Hrd1fl/fl-FoxP3cre (n = 2–13 per group). Data are shown as mean ± SD. *P < 0.05 and **P < 0.01 by 2-tailed Student’s t test.

