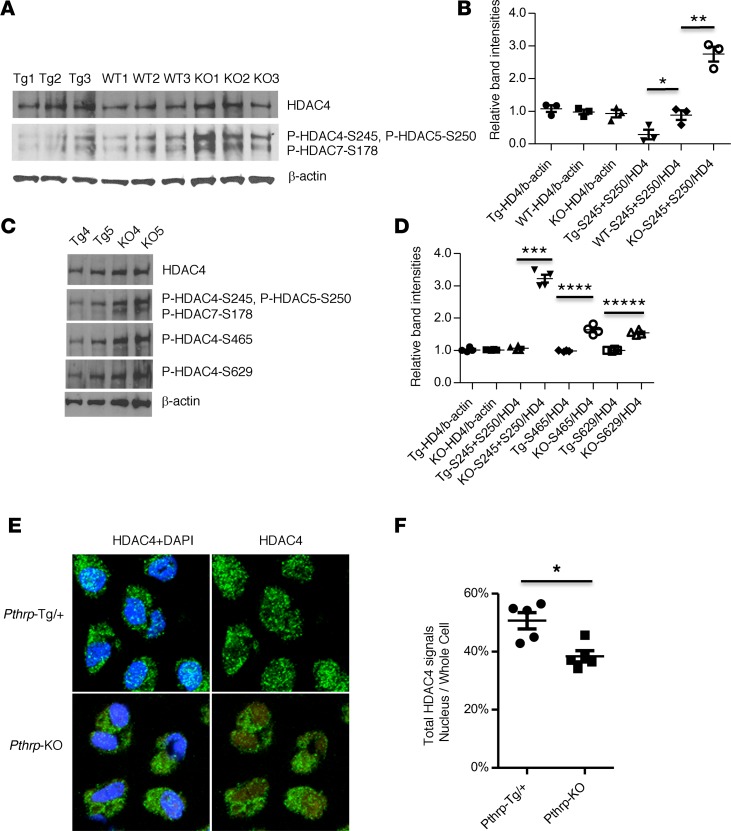
Figure 3. HDAC4 dephosphorylation and nuclear translocation by PTHrP signaling in vivo.
(A and C) Western blots for the 14-3-3–binding sites (see complete unedited blots in the supplemental material). Whole cell lysate from microdissected proliferating chondrocyte regions in the proximal tibial growth plates at birth. Different sets of animals were used (A, n = 3, biological triplicates; C, n = 2, biological duplicates). Tg, Pthrp-Tg/+; KO, Pthrp-KO. WT1 or WT2 and WT3 are derived from Tg litter or KO litter, respectively (A). Tg1 and Tg2 are littermates. The KO pups are derived from different litters. (B and D) Relative band intensities were calculated from the bands in A (n = 3) or C (n = 2) as well as Supplemental Figure 4A (n = 2). HDAC4 was normalized to β-actin. Phosphorylated HDACs were normalized to HDAC4. S245+S250, the sum of phospho HDAC4-Ser245 and phospho HDAC5-Ser250; S465, phospho HDAC4-Ser465; S629, phospho HDAC4-Ser629. *P = 0.03, **P = 0.002, ***P = 1 × 10⁻⁵, ****P = 4 × 10⁻⁴, *****P = 5 × 10⁻⁵ by the 2-tailed Student’s t test. (E) Representative IHC images by confocal microscopy (original magnification, ×620). Round chondrocytes in the proximal tibial growth plates at birth: green (HDAC4) and blue (DAPI, nuclear stain). (F) Average ratio of total HDAC4 intensities in nuclei to those in whole cells (mean ± SEM, n = 5, biological replicates). The ratio for Pthrp-Tg/+ cells was 50.7% ± 2.4% and for Pthrp-KO cells was 38.4% ± 1.3%. The detailed calculation is shown in Supplemental Figure 4B and Supplemental Table 1. *P < 0.0001 by random intercept linear mixed-effects model (SAS Institute). A P value of less than 0.05 was considered significant (B, D, and F).

