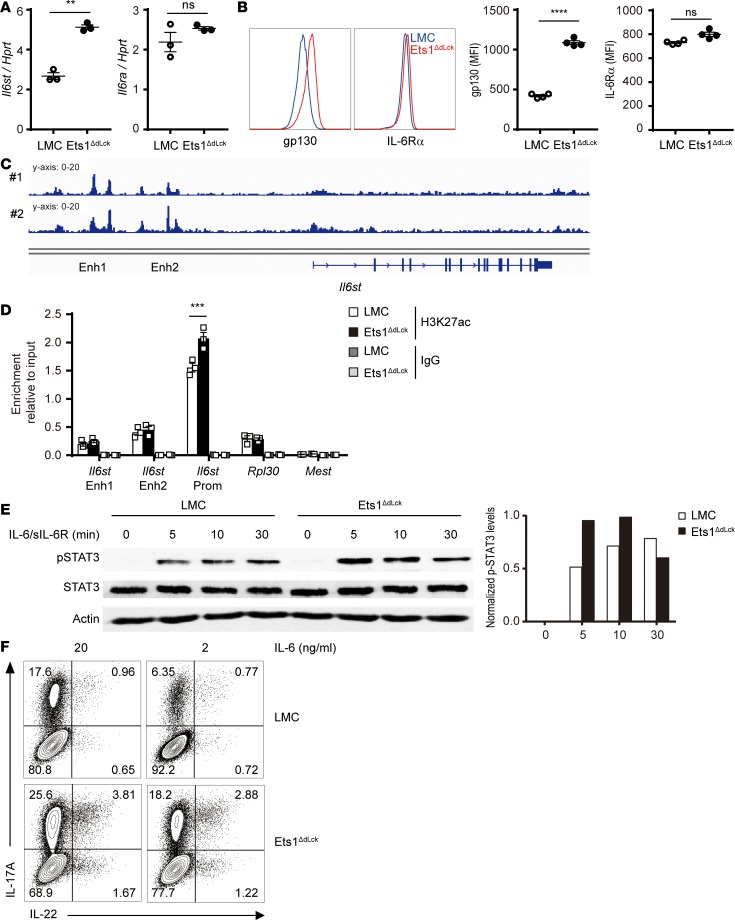
Figure 5. Effect of Ets1 deficiency on gp130 expression, IL-17A and IL-22 production, and IL-6–mediated STAT3 activation.
(A) RNA was collected from the naive CD4+ T cells from LMC and Ets1ΔdLck mice, and relative expression of Il6st and Il6ra were evaluated by qPCR (n = 3). (B) Protein levels of Il6st (gp130) and Il6ra (IL-6Rα) were examined by surface staining. Mean fluorescence intensity (MFI) is presented (n = 4). (C) Ets1 ChIP-seq confirmed binding of Ets1 on regulatory elements of Il6st locus. Numbers represent 2 different sets of data. (D) Histone modification (H3K27ac) of Il6st locus was analyzed by ChIP-qPCR. Quantification represents 3 independent experiments. (E) Naive CD4+ T cells from LMC and Ets1ΔdLck mice were stimulated with IL-6/sIL-6R complex for the indicated times, and STAT3, phospho-STAT3, and actin expression was examined by immunoblotting. The blots were scanned, and the levels of p-STAT3 were normalized to the total amount of STAT3 and depicted as a graph. (F) Naive CD4+ T cells from LMC and Ets1ΔdLck mice were cultured 3–4 days with plate-bound anti-CD3 and anti-CD28 in the presence of skewing cytokines IL-1β, IL-6, and IL-23. IL-6 was given under optimal (20 ng/ml) or limited (2 ng/ml) conditions. Expressions of the indicated cytokines were analyzed by flow cytometry. Representative plot comes from the analysis of 4–6 individual mice. Error bars represent the mean ± SEM. **P ≤ 0.005; ***P ≤ 0.0005; ****P ≤ 0.0001; Student’s t test.

