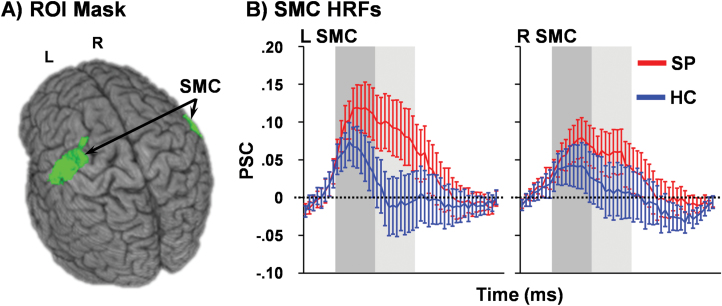
Fig. 2.
Left (L) and right (R) sensorimotor cortices (SMC; green) derived from a previous publication2 were used as regions of interest (ROI) for the current analysis (A). In B, percent signal change (PSC) data are presented for patients with schizophrenia (SP; red line) and healthy controls (HC; blue line) for the entire hemodynamic response function (HRF), with shaded bars indicating peak (dark gray) and late peak (light gray) phases. Error bars represent standard error of the mean.

