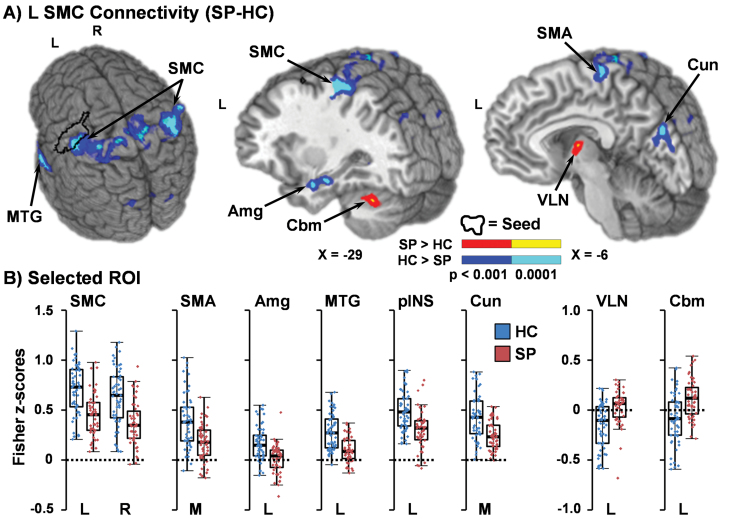
Fig. 3.
A depicts results from connectivity analysis performed with the left sensorimotor cortex (SMC; black outline) as an empirically derived seed from the Group × Peak interaction during the proactive response inhibition trials. Regions are color coded based on whether patients with schizophrenia (SP) exhibited either decreased (cool colors: P < .001 = blue; P < .0001 = cyan) or increased (warm colors: P < .001= red; P < .0001 = yellow) connectivity relative to healthy controls (HC). Locations of sagittal (X) slices are given according to the Talairach atlas. Left (L), right (R), and midline (M) regions of interest (ROI) showing decreased functional connectivity for SP included the SMC, supplementary motor area (SMA), amygdala (Amg), middle temporal gyrus (MTG), posterior insula (pINS; not pictured) and cuneus (Cun; B). ROI where SP exhibited increased connectivity included ventral lateral nucleus (VLN) of the thalamus, and Lobules VI/VIIa of the cerebellum (Cbm). All box and scatter plots present Fisher z-scores within selected ROI for HC (blue) and SP (red).

