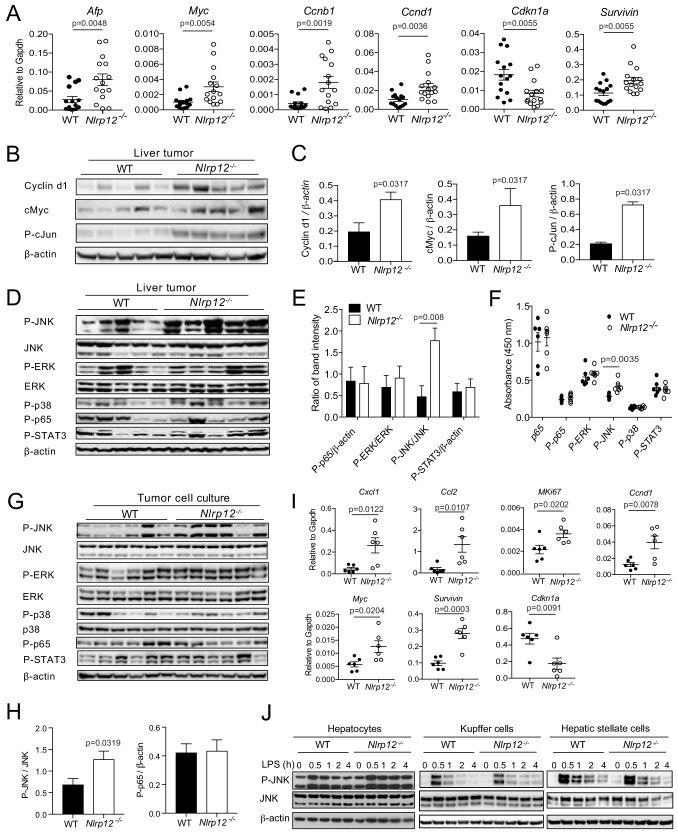
Figure 4. NLRP12-deficiency leads to increased expression of proliferative genes and activation of the JNK pathway.
WT (n = 15) and Nlrp12-/- (n = 15) mice were injected with DEN (25 mg/kg i.p.) at the age of 14 days and euthanized at 10 months later. (A) Liver tumor tissues were analyzed for the expression of the indicated genes by real-time qPCR. Data represent means ± SEM (n = 15; each sample represents individual mouse). Statistical difference was determined by two-tailed unpaired t-test. (B) Liver tumor lysates were immunoblotted for Cyclin d1, cMyc, and P-cJun. β-actin was used as a loading control. (C) Band intensities of Cyclind1, cMyc, and P-cJun were measured. Data represent means ± SEM (n = 5, each sample represents individual mouse). Statistical difference was determined by two-tailed unpaired t-test. (D) Liver tumor lysates were analyzed for the activation of JNK, ERK, p38, p65, and STAT3 by Western blotting. β-actin was used as a loading control. Each lane represents individual mouse. (E) Band intensities of P-JNK, P-ERK, P-p65, and P-STAT3 shown in D were measured. Data represent means ± SEM (n = 5). Statistical difference was determined by two-tailed unpaired t-test. (F) The levels in p65, P-p65, P-ERK, P-JNK, P-p38, and P-STAT3 in tumor lysates (0.5 mg/ml) from different mice were measured by ELISA. Data represent means ± SEM (n = 6). Statistical difference was determined by two-tailed unpaired t-test. (G) Hepatocytes were isolated from liver tumors and analyzed for the activation of JNK, ERK, p38, p65, and STAT3 by Western blotting. Each lane represents individual mouse sample. (H) Densitometric analysis of P-JNK, and P-p65 immunoreactive bands are shown. Data represent means ± SEM (n = 6). Statistical difference was determined by two-tailed unpaired t-test. (I) RNA isolated from the tumor hepatocytes was analyzed for the expression of chemokines and proliferative genes. Data represent means ± SEM (n = 6, each sample represents individual mouse). Statistical difference was determined by two-tailed unpaired t-test. (J) Hepatocytes, Kupffer cells, and hepatic stellate cells were isolated from liver tumors and stimulated with LPS (1 ug/ml). Activation of JNK was measured by Western blotting.


