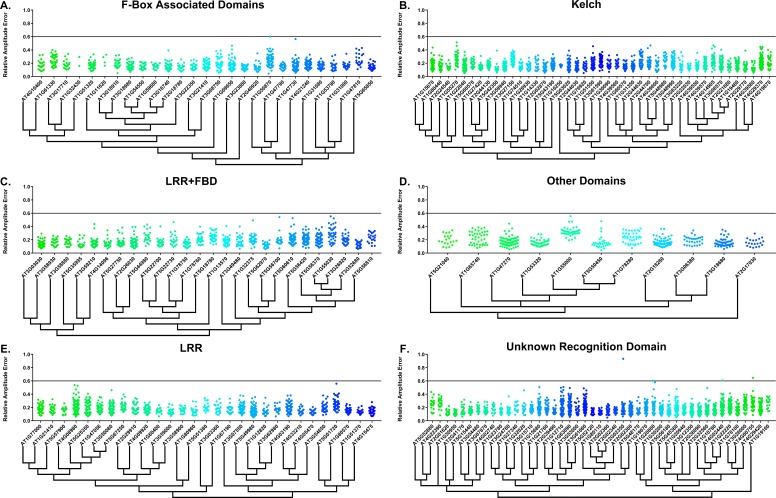
Figure 2. RAE distributions of F-box decoy plants.
Values presented are the RAE for each individual T1 seedling. The black line represents the standard RAE cutoff of 0.6. Genes are separated by protein recognition domain and ordered by closest protein homology using Phylogeny.Fr, (Dereeper et al., 2008), and a tree showing that homology is displayed beneath the graph. F-Box Associated Domains = FBA1, FBA3, and FBD only. Other Domains = TUB, JmjC, LysM, WD40, zf_MYND, and DUF295. Only data from those experiments where the control CCA1p::Luciferase plants display a standard deviation less than 0.75 were included in our analyses.


