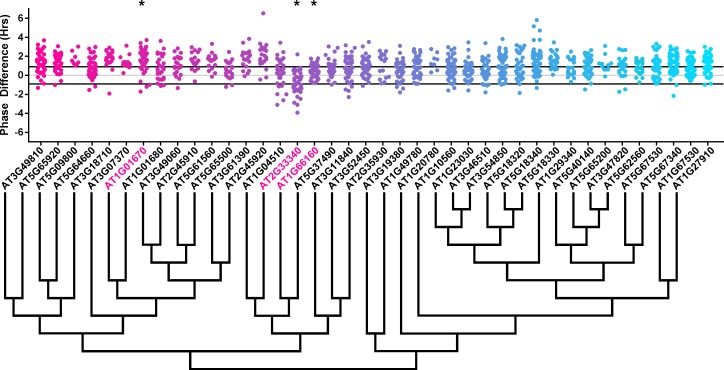
Figure 5. Phase distributions of U-box decoy plants.
Values presented are the difference between the period of the individual decoy plant and the average period of the CCA1p::Luciferase control in the accompanying experiment. The grey line is at the average control value and the black lines are at ±the standard deviation of the control plants. Genes are ordered by closest protein homology using Phylogeny.Fr, (Dereeper et al., 2008), and a tree showing that homology is displayed beneath the graph. * and pink gene names = The entire population differs from wildtype with a Bonferroni-corrected p<1.00×10⁻³.


