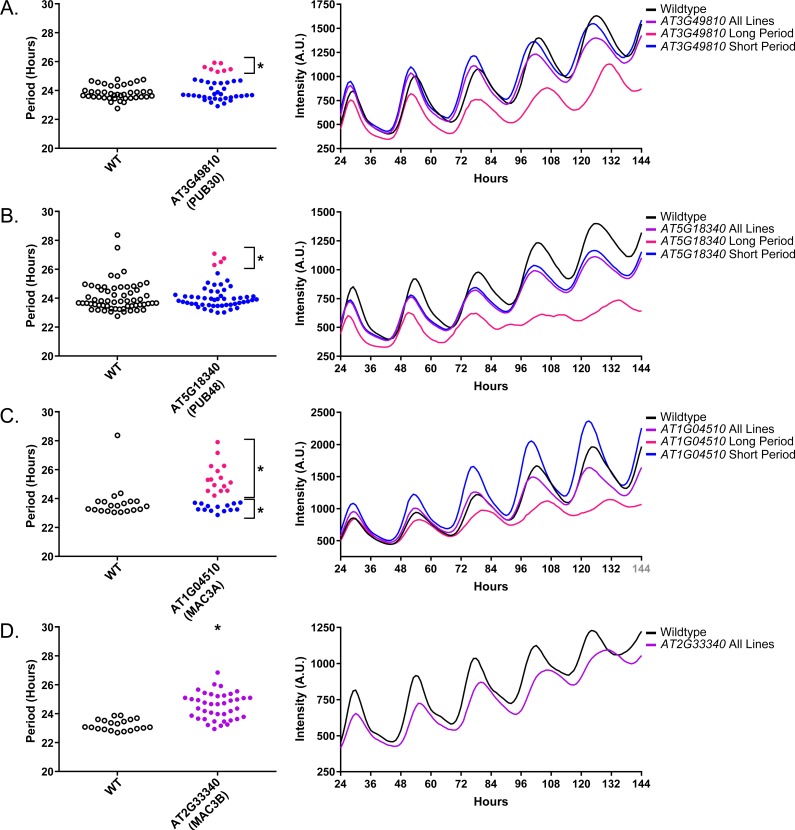
Figure 9. Circadian Phenotypes for selected high-priority U-box decoy populations.
Period values and average traces for decoy plants with significant differences from the control across the entire population or a sub-population of plants greater than 1. Period values presented are raw period lengths as determined by CCA1p::Luciferase, and traces are calculated from the average image intensity across each seedling at each hour throughout the duration of the imaging experiment. Time 0 is defined as the dawn of the release into LL. (A) AT3G49810 (PUB30) decoy. (B) AT5G18340 (PUB48) decoy. (C) AT104510 (MAC3A) decoy. D) AT2G33340 (MAC3B) decoy. Brackets define individual groups used for statistical testing against the wildtype control using a Welch’s t-test with a Bonferroni-corrected α of 1.09 × 10⁻³. * represents p<α. When multiple subpopulations were detected, the members of each group were separately averaged and presented in the traces along with the average of all plants.

