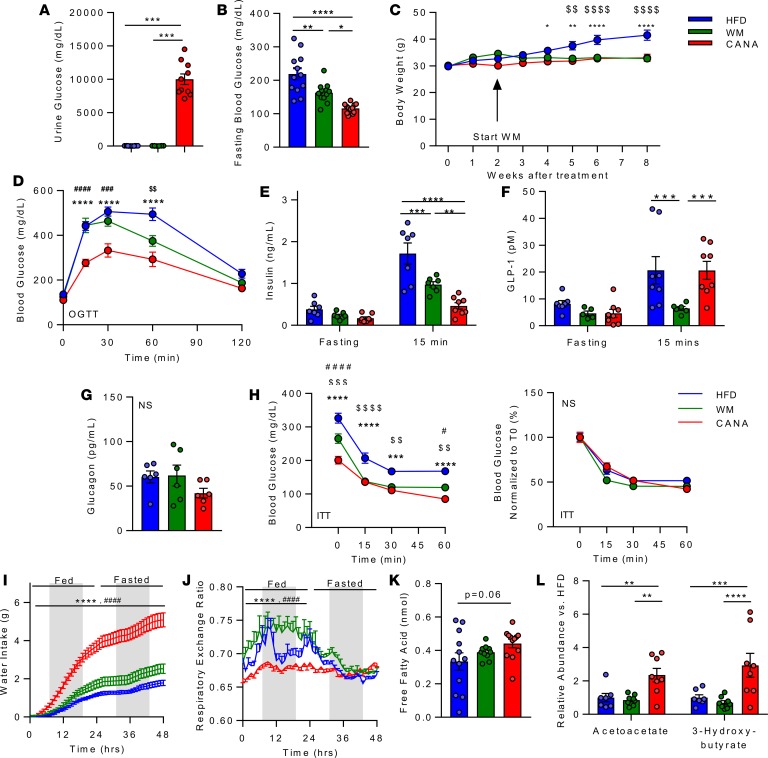
Figure 1. Canagliflozin reduces blood glucose, improves glucose tolerance, and causes a shift toward lipid utilization.
(A) Urinary glucose in HFD, weight matched (WM), and HFD + CANA (CANA) after an overnight fast, after 8 weeks of treatment (n = 8–11/group). (B) Blood glucose after a 16-hour fast (n = 8/group). (C) Body weight (n = 12/group). (D) Oral glucose tolerance (2 g/kg, n = 12/group). (E) Plasma insulin, fasting and 15 minutes after glucose gavage (n = 8/group). (F) Plasma glucagon-like peptide-1 (GLP-1), fasting and 15 minutes after glucose gavage (n = 8/group). (G) Fasting plasma glucagon (n = 6/group). (H) Insulin tolerance (0.75 U/kg, n = 8/group). (I) Water intake (n = 6–12/group). (J) Respiratory exchange ratio (n = 6–12/group). (K) Serum-free fatty acids (4-hour fast, n = 11–12/group). (L) Serum ketones (LC/MS, n = 7–8/group). P values (1- or 2-way ANOVA). *P < 0.05, **P < 0.01, ***P < 0.001, ****P < 0.0001 in HFD vs. CANA. #P < 0.05, ##P < 0.01, ###P < 0.001, ####P < 0.0001 in WM vs. CANA; and $P < 0.05, $$P < 0.01, $$$P < 0.001, $$$$P < 0.0001 in WM vs. HFD.

