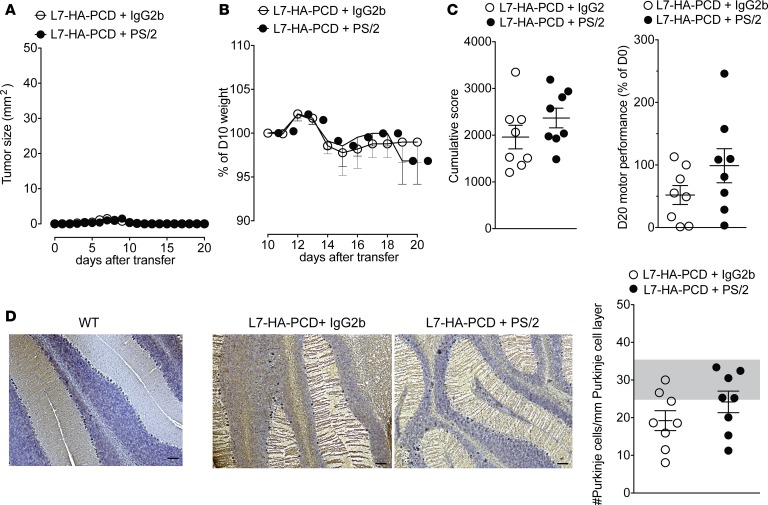
Figure 2. Treatment with an anti–α4 integrin mAb shows no efficacy in the PCD model.
(A) Tumor size, (B) mouse weight loss, and (C) rotarod cumulative score (left) and performance on day 20 (right) of L7-HA-PCD mice treated with PS/2 (anti–α4 integrin mAb) or control IgG2b from day 10 after the induction of disease onward (n = 8/group, 2 independent experiments). (D) Left: representative staining for calbindin (violet) and nuclear counterstaining with hematoxylin (blue) on cerebellar sections from a control WT mouse, and from L7-HA-PCD mice treated with isotype control or PS/2. Scale bar: 100 μm. Right: quantitative assessment of Purkinje cell density in L7-HA-PCD mice treated with IgG2b or PS/2 (n = 8/group, 2 independent experiments). The shaded area represents the normal range in WT mice, meaning mean ± 2SD.

