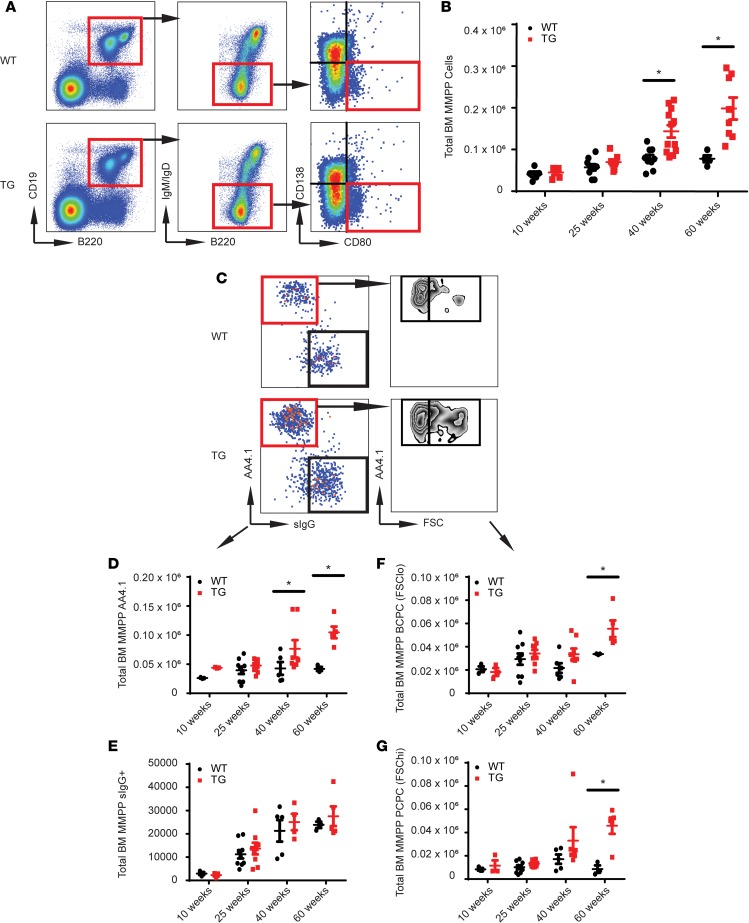
Figure 2. A post–germinal center B cell increases in Tg mice with age.
(A) Representative flow diagram depicting the PC stem/progenitor population phenotype in the BM of WT and Tg mice (n = 6). (B) Total number of MMPP cells in the BM of WT and Tg mice over advancing ages (n = 6). (C) Representative flow plot using AA4.1, sIg, and forward scatter (FSC) to identify B cell populations in the BM (n = 6). (D) Total number of AA4.1+ MMPP cells (n = 6) in WT versus Tg mice. (E) Total number of surface IgG+ MMPP cells (n = 6) in WT versus Tg mice. (F) Total number of AA4.1+FSClo PCPCs (n = 6). (G) Total number of AA4.1+FSChi PCPCs (n z= 6). In all panels, Student’s t test was used to calculate *P < 0.05, and error bars denote ± SEM.

