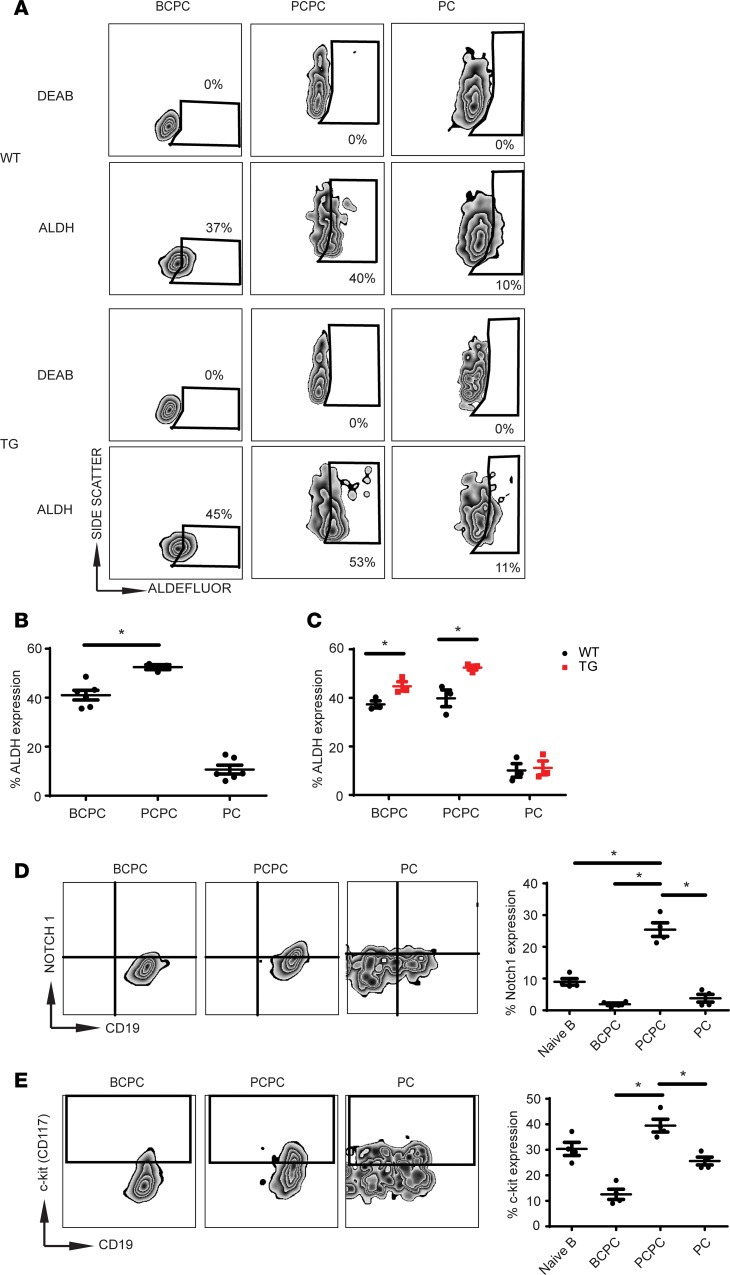
Figure 4. The PCPC population exhibits a “stem cell–like” phenotype.
(A) Representative flow dot plots of various cellular populations from the BM of WT and Tg mice. ALDH expression was determined by Aldefluor staining. The ALDH inhibitor DEAB was used to set the gate for negative staining (n = 3). (B) Total percentage of ALDH expression in each population (n = 6). (C) Total percentage of ALDH expression of indicated populations from WT and Tg mice (n = 3). (D) Expression of Notch1 determined by intracellular stain. Representative flow plots are depicted in the left and middle. Bar graph (far right) is an average of 4 mice. (E) Expression of c-Kit (CD117) in indicated cell populations. Representative flow plots are depicted in the left and middle. Bar graph (far right) is the average of 4 mice. In all panels, error bars denote ± SEM. Student’s t test was used to calculate significance, and *P < 0.05.

