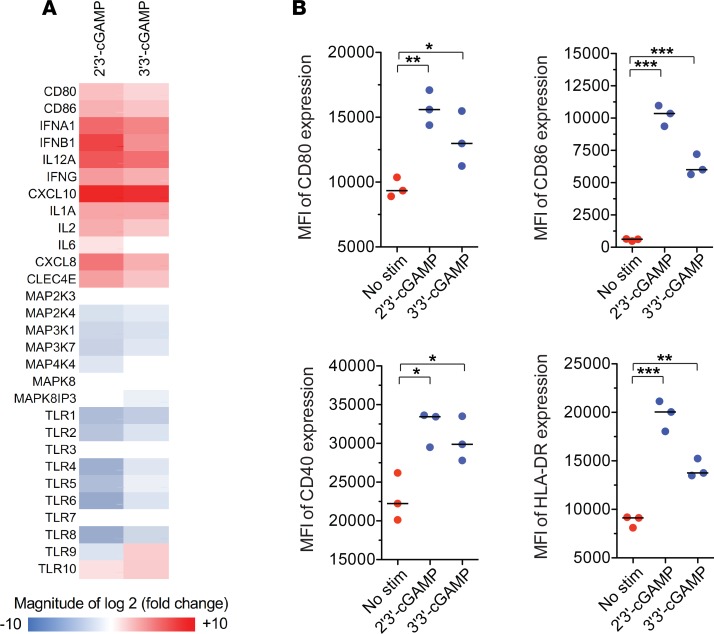
Figure 3. STING ligands drive the maturation of DCs.
(A) Expression profile of PRR pathway genes in CD1a+CD14– moDCs 24 hours after stimulation with 2′3′-cGAMP or 3′3′-cGAMP at concentrations of 10 μg/ml. Data are shown relative to unstimulated moDCs from the same donor. stim, stimulation. (B) Expression of maturation markers on CD1a+CD14– moDCs stimulated with 2′3′-cGAMP or 3′3′-cGAMP at concentrations of 10 μg/ml. Error bars indicate mean ± SEM (n = 3 replicates). *P < 0.05, **P < 0.01, ***P < 0.001 (unpaired t test).

