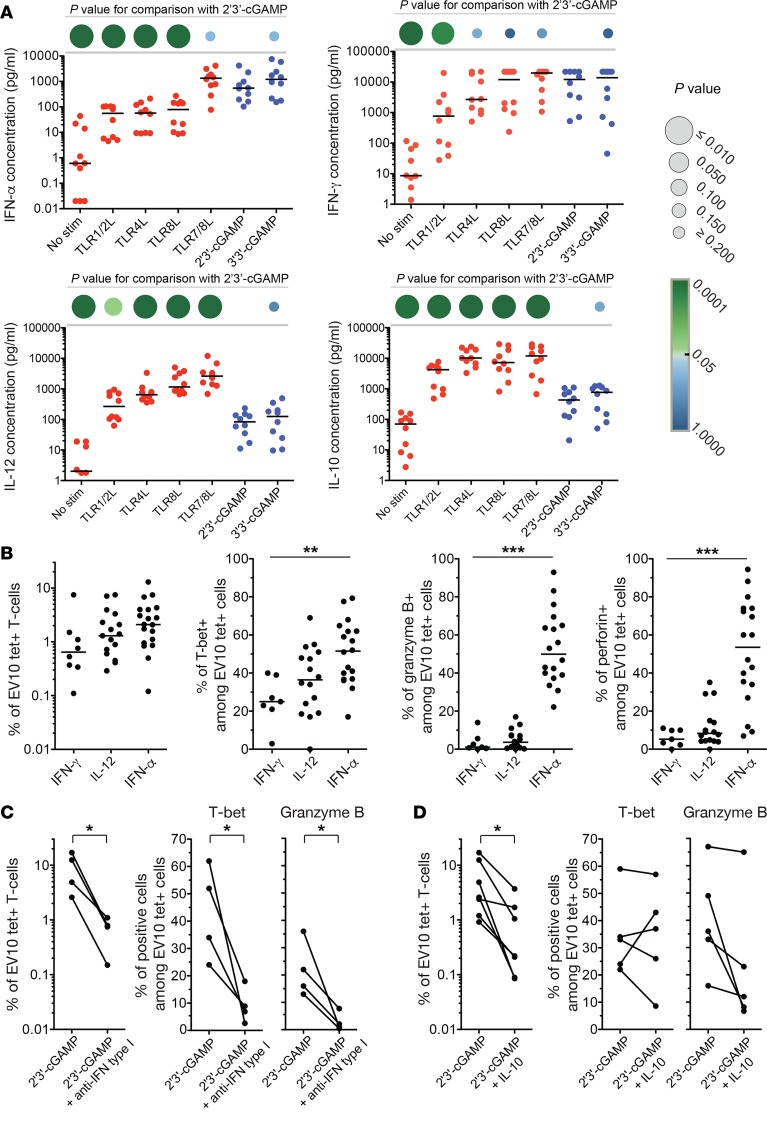
Figure 4. STING ligands elicit a type I IFN response.
(A) Extracellular concentrations of various cytokines secreted by PBMCs in response to overnight stimulation with various PRR ligands. Each dot represents 1 donor per condition. Horizontal bars indicate median values. P values are represented as circles with variable size and color intensity (Mann-Whitney U test). (B) Frequency of EV10-specific CD8+ T cells and intracellular expression of T-bet, perforin, and granzyme B among EV10-specific CD8+ T cells primed in the presence of IFN-α (0.1 μg/ml), IFN-γ (0.1 μg/ml), or IL-12 (0.1 μg/ml). Each dot represents 1 HLA-A2+ donor per condition. Horizontal bars indicate median values. **P < 0.01, ***P < 0.001 (Kruskal-Wallis test). (C and D) Frequency of EV10-specific CD8+ T cells and intracellular expression of T-bet and granzyme B among EV10-specific CD8+ T cells primed in the presence of 2′3′-cGAMP, either alone or together with type I IFN blocking antibodies (C) or IL-10 (0.1 μg/ml) (D). *P < 0.05 (paired t test).

