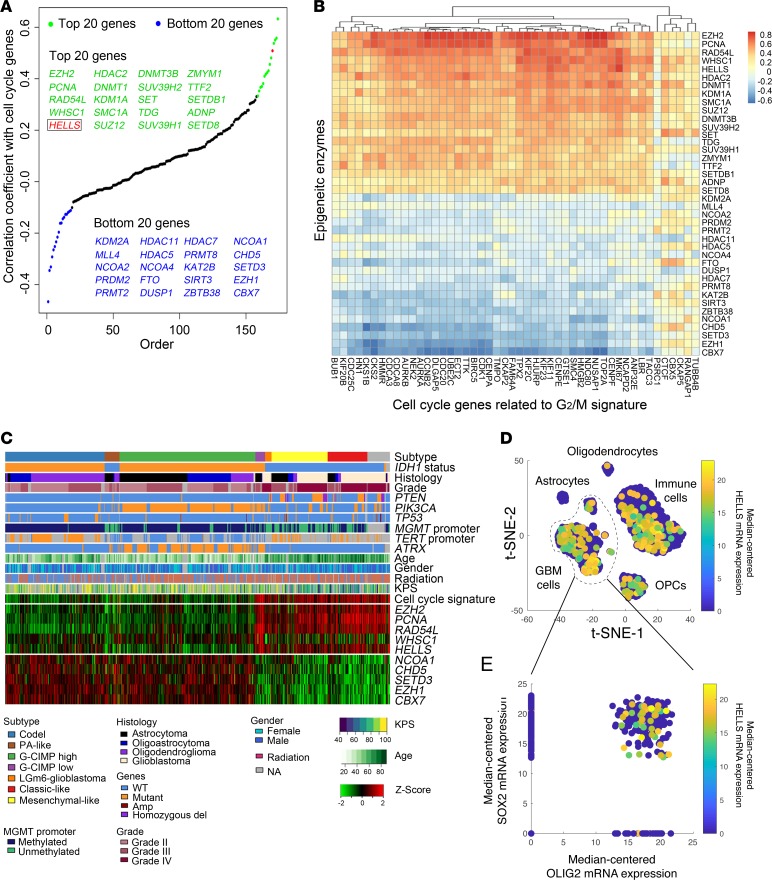
Figure 1. Proliferating glioma cells express HELLS.
(A) Correlation between mRNA expression levels of chromatin regulators and G2/M cell cycle signature in glioblastoma patients. The top 20 (green) and bottom 20 (blue) epigenetic regulators are listed. HELLS is labeled in red. (B) Heatmap displaying correlations between epigenetic regulators and individual G2/M signature gene expression in glioblastoma patients. The top 20 and bottom 20 chromatin regulators are displayed. (C) RNA-seq, whole exome, and clinical phenotype data were aggregated from TCGA glioblastoma (GBM) and low-grade glioma (LGG) data set to visualize the expression patterns of top 5 and bottom 5 epigenetic regulators identified in A. “Codel,” codeletion of chromosomes 1p and 19q; PA-like, pilocytic astrocytoma–like; CIMP, glioma-CpG island methylator phenotype; LGm6-GBM, a subgroup of glioma enriched for histologic low-grade gliomas that also contains a subset of tumors with GBM-defining histologic criteria; KPS, Karnofsky performance status. (D and E) HELLS expression is enriched in SOX2+ glioblastoma cells in bulk tumor single-cell RNA-seq data sets. (D) t-Distributed stochastic neighbor embedding (t-SNE) plot of combined single-cell RNA-seq data from 4 glioblastoma tumors. Each dot represents a single cell with HELLS mRNA expression denoted by the color map. (E) Scatter plot of SOX2 and OLIG2 mRNA expression among glioblastoma tumor cells. Each dot represents a single cell with HELLS mRNA expression denoted by the color map.

