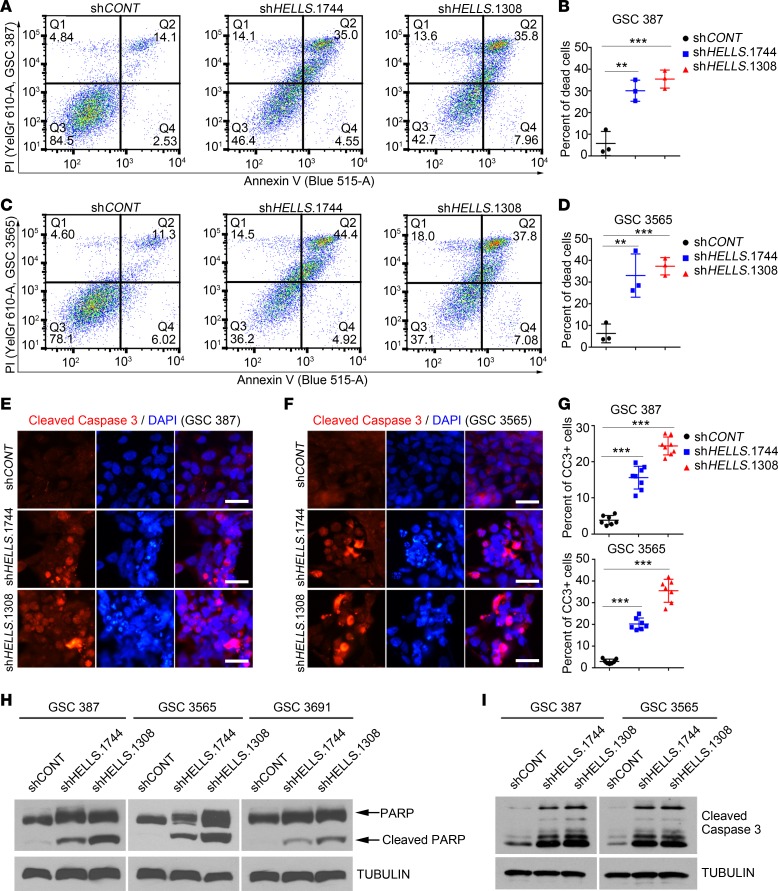
Figure 6. Disruption of HELLS expression induces GSC apoptosis.
(A) Flow cytometry of annexin V/propidium iodide (annexin V/PI) staining in GSC 387 analyzed 48 hours after HELLS knockdown. Signals from PI are shown on the y axis, and those from annexin V are shown on the x axis. Three independent experiments were performed. (B) Quantification of annexin V/PI double-positive populations from A. Three independent experiments were performed. Data are presented as mean ± SD. **P < 0.01, ***P < 0.001, by 1-way ANOVA with Tukey’s multiple comparisons test. (C) Flow cytometry of annexin V/PI staining in GSC 3565 analyzed 48 hours after HELLS knockdown. Signals from PI are shown on the y axis, and those from annexin V are shown in x axis. Three independent experiments were performed. (D) Quantification of annexin V/PI double-positive populations from C. Three independent experiments were performed. Data are presented as mean ± SD. **P < 0.01, ***P < 0.001, by 1-way ANOVA with Tukey’s multiple comparisons test. (E and F) Cleaved caspase-3 staining in GSC 387 (E) and 3565 (F) after HELLS knockdown. Three independent experiments were performed. Cleaved caspase-3 signals are shown as red and DAPI as blue. Scale bars: 20 μm. (G) Quantification of cleaved caspase-3+ cells in GSC 387 (top) and 3565 (bottom) after HELLS knockdown. Data are presented as mean ± SD. ***P < 0.001, by 1-way ANOVA with Tukey’s multiple comparisons test. For GSC 387: shCONT, n = 7; shHELLS.1744, n = 8; shHELLS.1308, n = 8. For GSC 3565: shCONT, n = 7; shHELLS.1744, n = 7; shHELLS.1308, n = 7. (H and I) Immunoblot for cleavage of PARP (H) and caspase-3 (I) in GSC 387, 3565, and 3691 after HELLS knockdown. Three independent experiments were performed.

