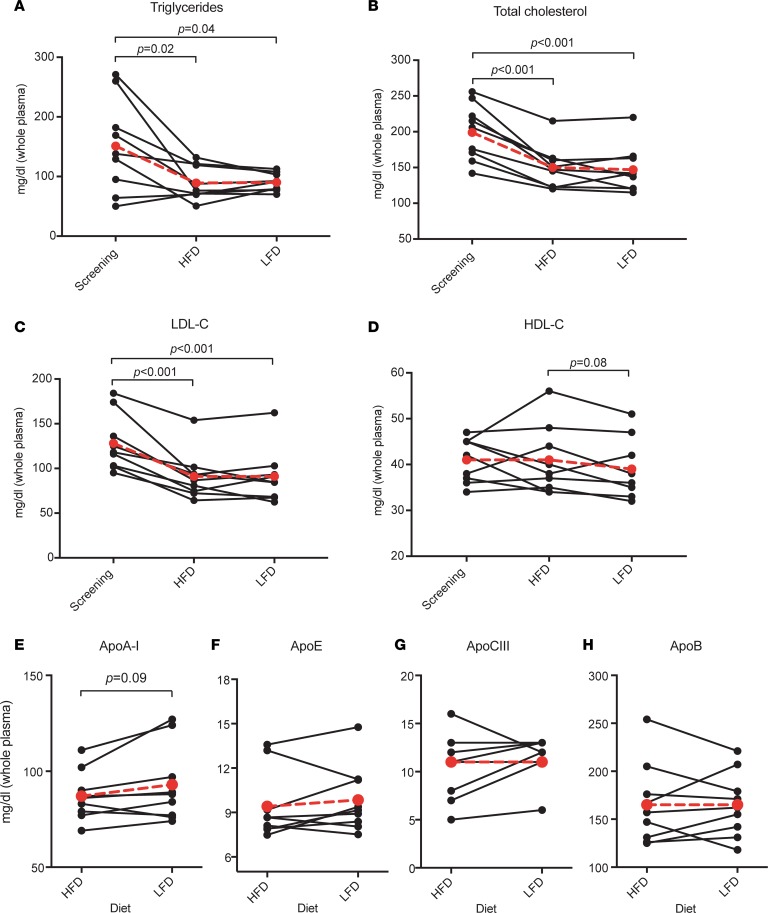
Figure 2. Effect of diet on fasting concentrations of plasma lipids and apolipoproteins.
Values (mg/dl) were measured at each study participant’s screening visit (lipids only) and following completion of each dietary intervention. HFD, high-fat diet; LFD, low-fat diet. Mean values (n = 9) shown in larger red circles and dotted red lines. P values were calculated using 2-tailed t test. (A) Triglycerides. (B) Total cholesterol. (C) LDL-cholesterol. (D) HDL-cholesterol. (E) ApoA-I. (F) ApoE. (G) ApoCIII. (H) ApoB.

