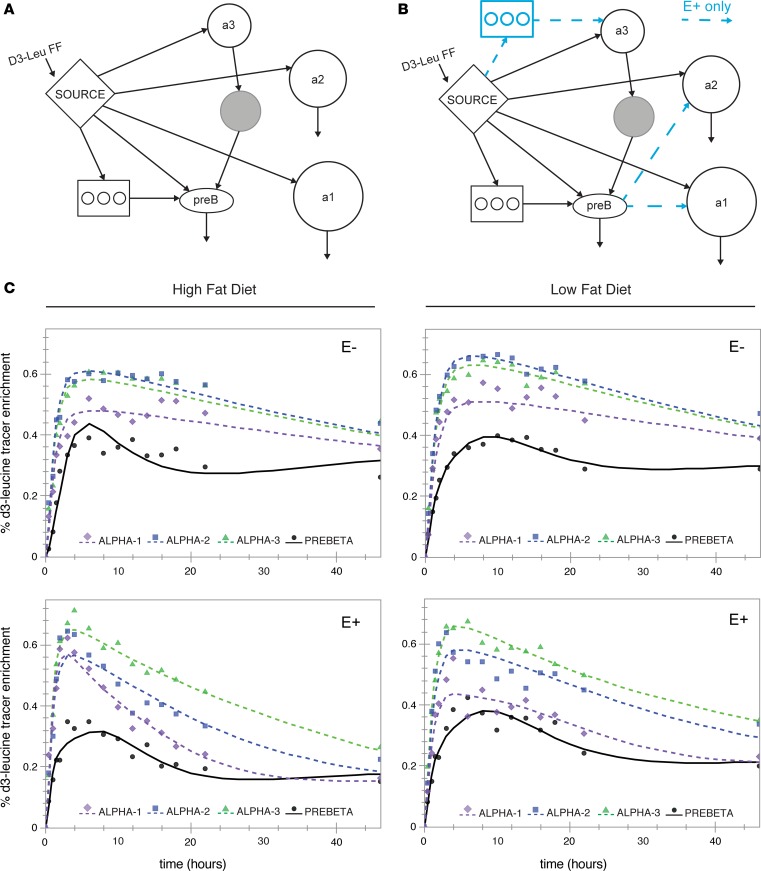
Figure 3. Model fit for apoA-I tracer enrichments for each HDL subspecies across 2 diets.
(A) SAAM-II compartmental model (bare-minimum model; see ref. 12). (B) Modifications to the bare-minimum model. Blue arrows and delay compartment represent additional pathways for the HDL containing apoE (E+) subspecies only. (C) Model fit for the mean (n = 9) apoA-I tracer enrichment on 4 sizes of HDL, across each HDL subspecies and diet. The percentage D3-leucine (D3-Leu) tracer enrichments (D3-leucine/[D3-leucine + D0-leucine] × 100) were generated by averaging all participants’ enrichments (n = 9) at each time point and modeling them as a single participant. Points = data; lines = model fit; a1 = α-1; a2 = α-2; a3 = α-3; preb = pre-β. FF, forcing function.

