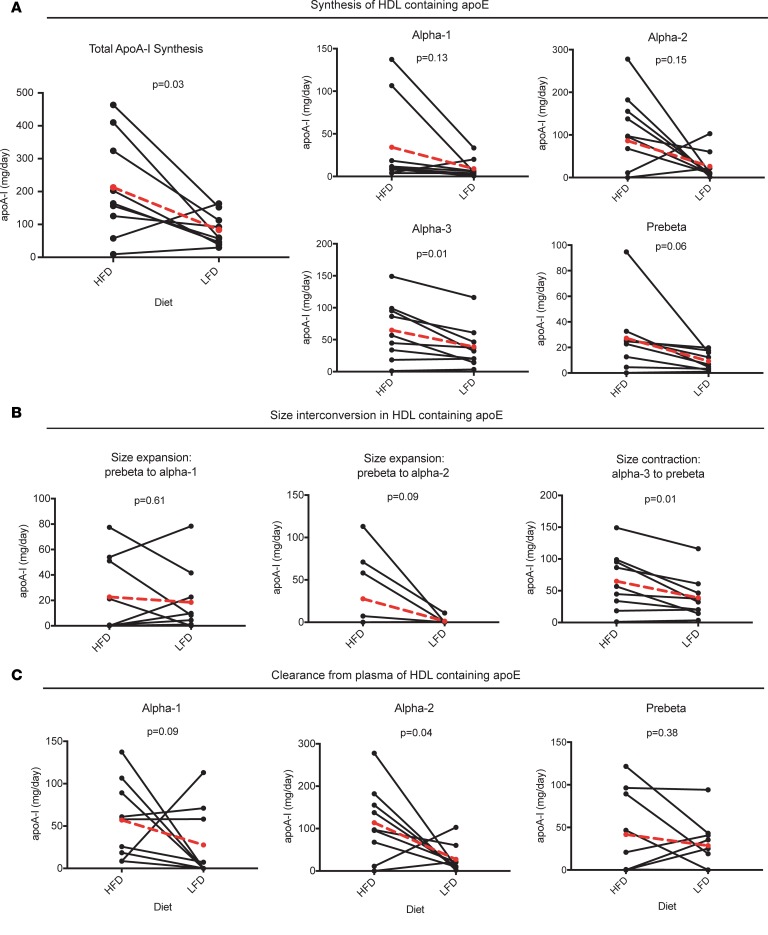
Figure 6. HDL containing apoE (E+): dietary unsaturated fat increases apoA-I flux through synthesis, size interconversion, and clearance pathways.
Individual values shown, with mean value (n = 9) in larger red circles and dotted red line. HFD, high-fat diet; LFD, low-fat diet. P values were calculated using paired 2-tailed t test. (A) Pathways from the source compartment to each HDL size, representing synthesis and secretion from the liver (or small intestine) and appearance in plasma. (B) Pathways between HDL sizes, representing HDL size expansion or contraction. The source size and destination size are indicated above each graph. (C) Clearance of apoA-I on each HDL size from plasma. Note that all of α-3 is converted to pre-β and is thus not directly cleared from plasma (see Figure 3, A and B).

