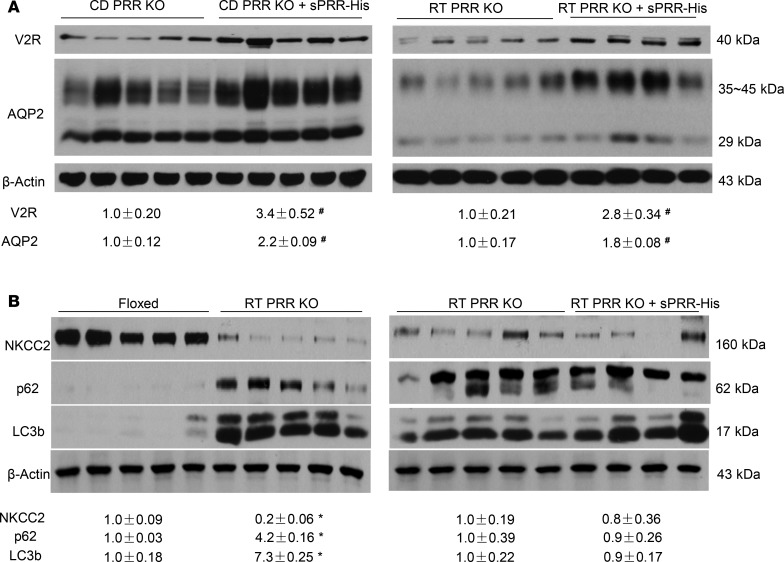
Figure 10. Analysis of renal expression of V2R and transporters in PRR-KO mice following sPRR-His infusion.
(A) Immunoblotting analysis of renal expression of V2R and AQP2 in CD PRR–KO (left panel) and RT PRR–KO mice (right panel) with and without sPRR-His infusion. (B) Immunoblotting analysis of renal expression of NKCC2 and markers of autophagosome accumulation including p62 and LC3b in floxed and RT PRR–KO mice under basal conditions (left panel). The comparison of abundance of these proteins was made between RT PRR–KO/vehicle and RT PRR–KO/sPRR-His mice (right panel). The values were normalized by β-actin and shown underneath the blots. Statistical significance was determined by using unpaired Student’s t test. *P < 0.05 versus floxed; #P < 0.05 vs. PRR-KO mice.

