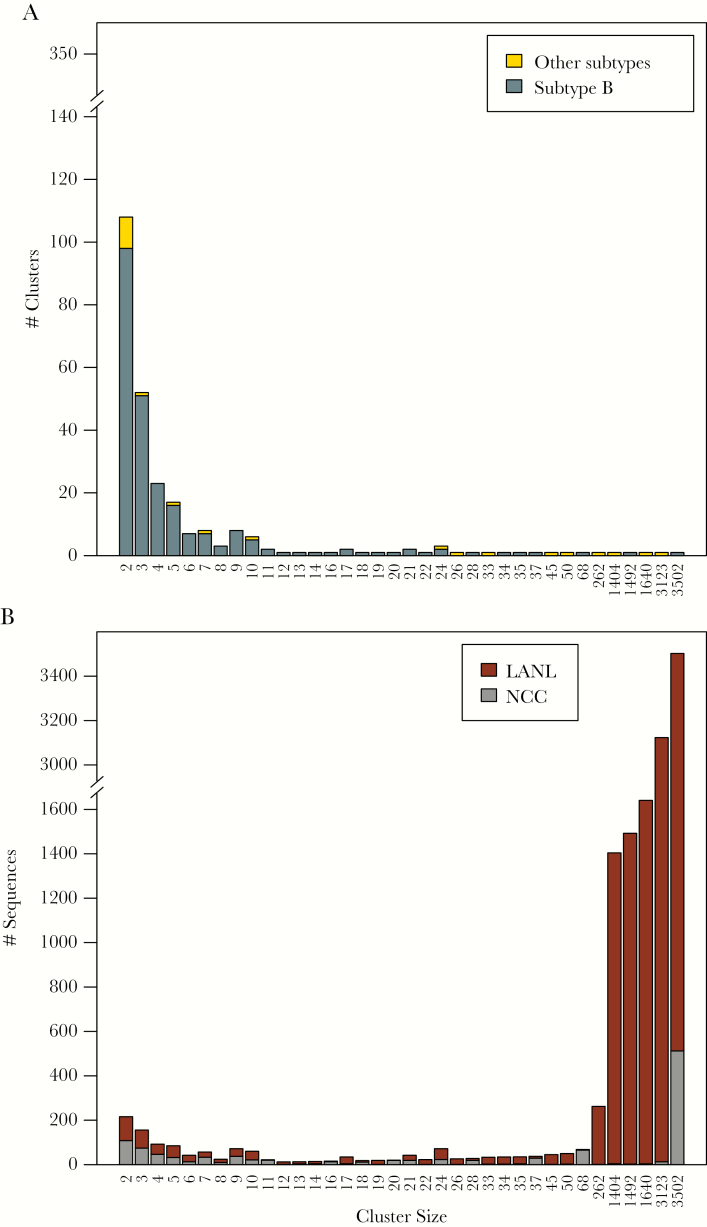
Figure 1.
Distribution and composition of cluster sizes in the Northern California Cohort (NCC) plus Los Alamos National Laboratories (LANL) transmission network. Figure 1A shows the numbers of clusters according to their sizes. Subtype B sequences are indicated in dark gray and non-subtype B sequences are indicated in yellow. Figure 1B shows the counts of NCC and LANL sequences in clusters grouped by their sizes with NCC sequences indicated in gray and LANL sequences indicated in dark red.

