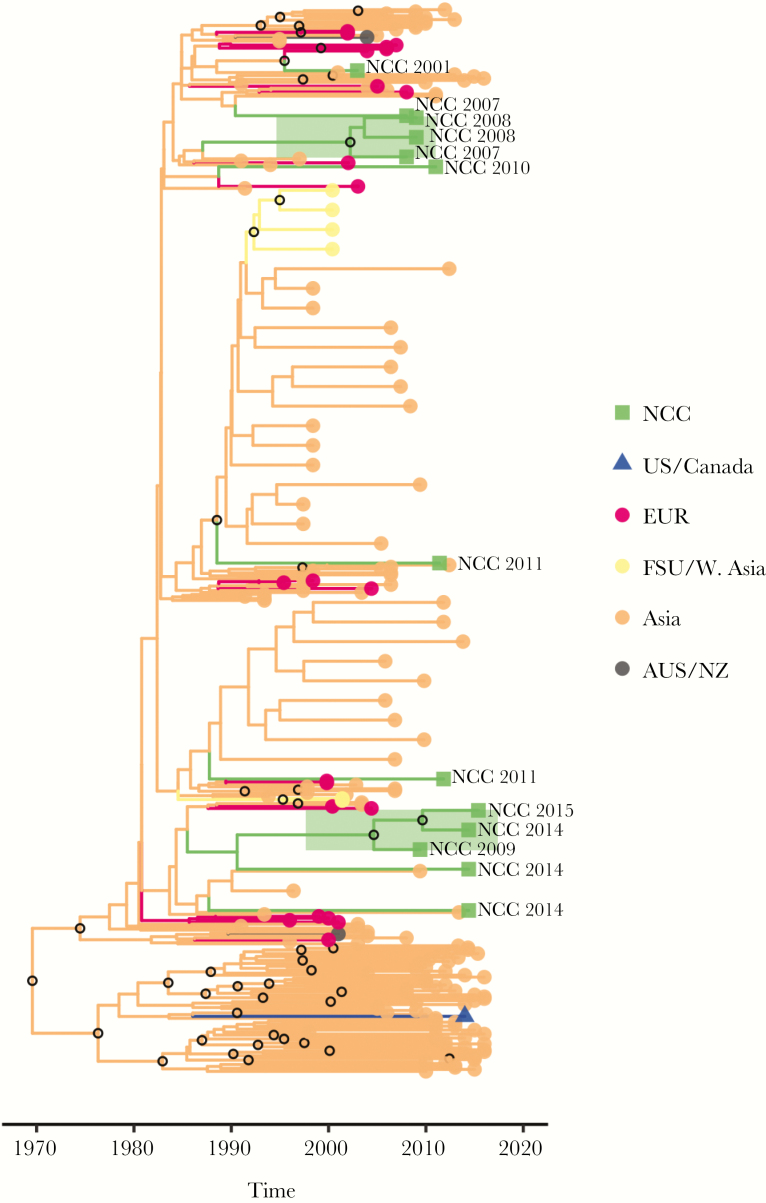
Figure 3.
Bayesian maximum clade credibility tree for the largest CRF01_AE cluster. Branch lengths are scaled in time and are colored according to region (legend at right) determined using maximum parsimony ancestral state reconstruction. Clades containing Northern California Cohort (NCC) sequences are expanded for clarity, and the 2 highly supported (posterior probability [PP] ≥90%) clades comprised of NCC sequences only are highlighted in green. In addition, the location of NCC sequences is indicated by taxon labeling. Open circles located at interior nodes indicate PP ≥90%.

