5.

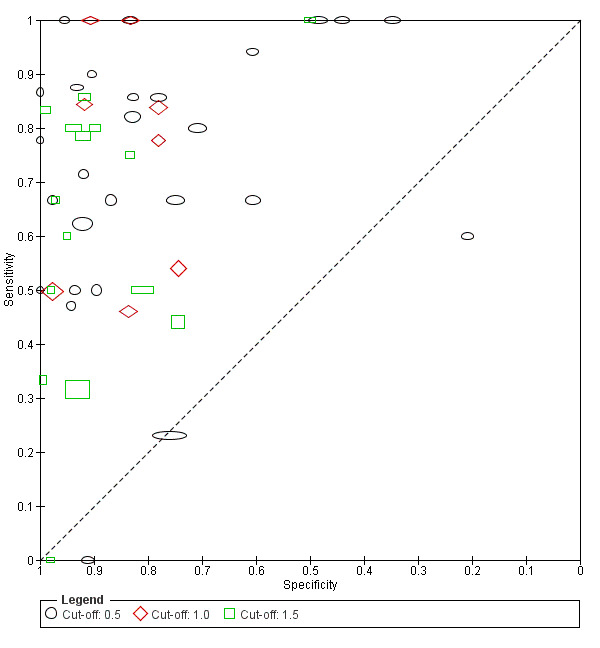
Plot of sensitivity versus specificity for all 54 studies, with different symbols for the different cut‐off values. The width of the symbols is proportional to the inverse standard error of the specificity in every study and the height of the symbols is proportional to the inverse standard error of the sensitivity.
