
6.
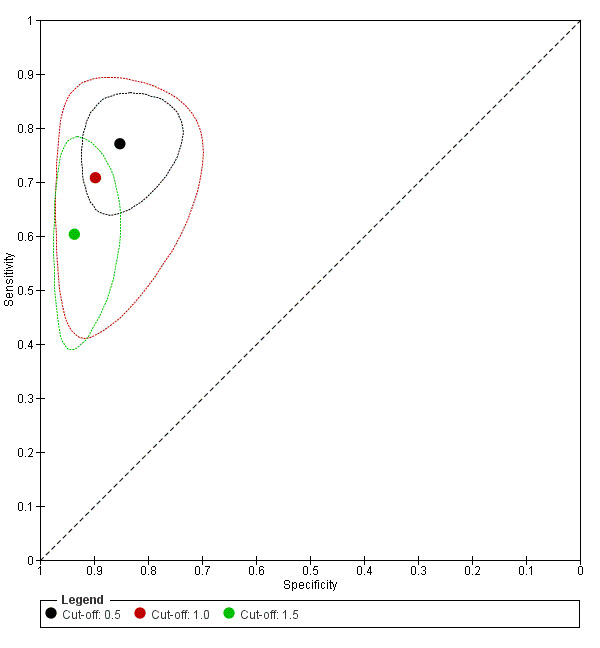
Summary ROC plots for galactomannan test at three different cut‐off values. The graph shows the point estimates of sensitivity and specificity (solid dots) and the 95% confidence regions (dotted lines) around it. Data for individual studies are not shown in this plot.