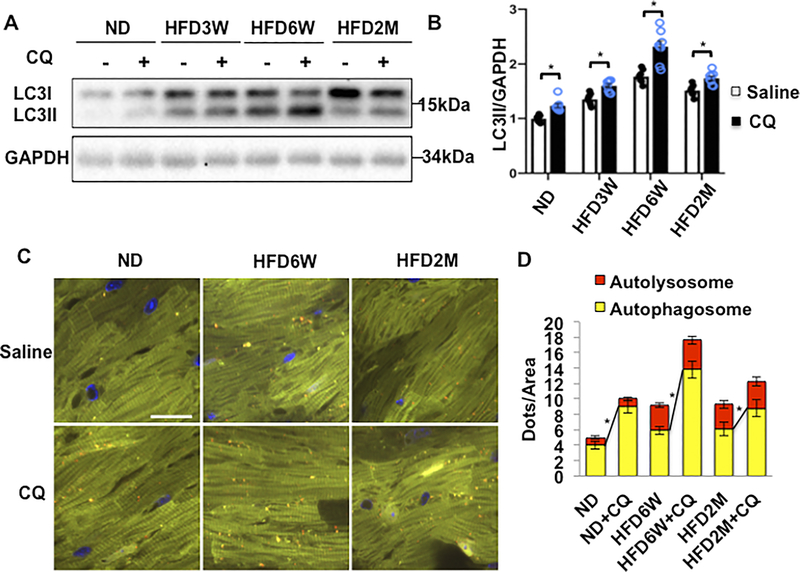
Figure 1. Autophagic flux in the heart was increased after 6 weeks of HFD feeding but inhibited after 2 months of HFD feeding.
(A) Evaluation of autophagic flux by Western blotting of LC3II protein. (B) Quantification of LC3II at different time points (n=8 in each group. Values are means ± S.E. *, p<0.05 using unpaired Student t test). (C) Evaluation of autophagic flux with TF-LC3 mice. (D) Quantification of autolysosome (red) and autophagosome (yellow) dots (n=8 in each group. Values are means ± S.E. *, p<0.05 using unpaired Student t test). Scale bar = 100 μm.

